In the October and November 2014 Tips of the Month (TOTM), we demonstrated that Gas-Oil-Ratio (GOR) has a large impact on the capacity of crude oil gathering lines. If GOR is less than the saturation solution gas, the increase in GOR reduces the viscosity and density of crude oil which causes the pressure drop to decrease. However, if the GOR exceeds the saturation solution gas the system becomes two phase and pressure drop increases.
The solution gas is a function of temperature, pressure, gas and liquid compositions. In this TOTM, we will study the impact of temperature on the crude oil properties in the gathering systems for the case presented in the November 2014 TOTM. Specifically, the variation of the crude oil relative density and viscosity with the temperature will be studied. Finally, the impact of temperature on the oil and gas velocity and pressure drop along a gathering line for nominal pressure of 6900 kPag (1000 psig) and nominal pipe size of 101.6 mm (4 inches) will be demonstrated using a multiphase rigorous method from a commercial simulator. The calculated properties, oil and gas velocities and pressure drops are presented in graphical format as a function of the oil stock tank volume flow rate, solution gas, RS, and temperature.
Case Study
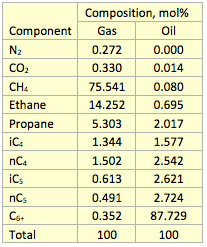
- For the purpose of illustration, we considered a case study for transporting a crude oil of relative density of 0.852 (°API = 34.6) at stock tank conditions combined with a gas with relative density of 0.751. The selected GORs were 0 (dead oil), 17.8, 35.6, and 89 Sm3 of gas/STm3 of oil (0, 100, 200, 500 scf/STB). The compositions of oil and gas are presented in Table 1. The oil C6+ was characterized as 30 hypothetical single carbon number (SCN) [1] ranging from SCN6 to SCN35 while the gas C6+ was characterized by 10 hypothetical SCN ranging from SCN6 to SCN15. For details of the SCN components, see Table 3.2 on page 64 of reference [1]. The mole fraction of SCN components were determined by an exponential decay algorithm [2]. The feed enters the line at 15.6 ˚C (60 ˚F) for case 1 and 43.3 ˚C (110 ˚F) for case 2.
Table 1. Feed composition at stock condition
The following assumptions were made:
- Steady state conditions
- The line is 1.601 km (1 mile) long with nominal size of 101.6 (4 inches), onshore buried line.
- Segment lengths and elevation changes are presented in Table 2 and Figure 1. This elevation profile is considered to be approximately equivalent to “rolling” terrain.
- Pipeline inside surface roughness of 46 microns (0.046 mm, 0.0018 inch)
- Line nominal pressure 6900 kPag (1000 psig)
- The feed enters the line at 15.6 ˚C (60 ˚F) for case 1 and 43.3 ˚C (110 ˚F) for case 2.
- The ground/ambient temperature, is 15.6 ˚C (60 ˚F)
- Water cut is 0 (no water in the feed).
- Overall heat transfer coefficients of 2.839 W/m2-˚C (0.5 Btu/hr-ft2-˚F), for onshore buried line.
- Simulation software ProMax [3] and using the Soave-Redlich-Kwong (SRK) Equation of State [4] for vapor-liquid equilibrium and Beggs-Brill method for two-phase pressure drop calculation [5].
Table 2. Line segment length and elevation change
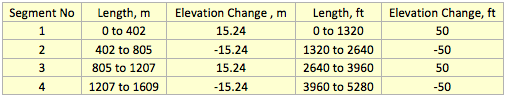
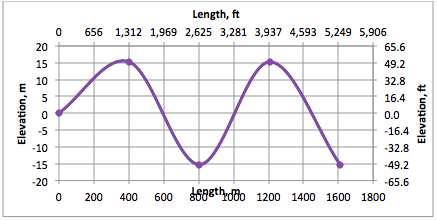
Figure 1. Gathering line elevation profile
Results and Discussions:
The two phase (oil and gas) flow through the gathering line was simulated by ProMax with SRK EOS for vapor-liquid equilibria and Beggs-Brill for two phase pressure drop calculations. Figure 2 presents the variation of temperature along the pipeline for the case of 0 GOR for an oil rate of 636 STm3/d (4000 STB/day). Since the ambient temperature was assumed to be 15.6°C (60°F), for case 1 the crude oil temperature in the line remained constant. However, for the second case the temperature dropped from 43.3°C (110°F) to about 40°C (104°F) within 1.6 km (1 mile) of the line. For the second case the average line temperature is about 41.7°C (107°F).
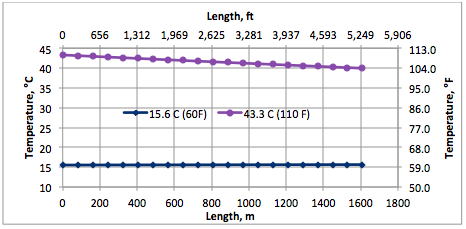
Figure 2. Variation of line temperature along gathering line for two feed temperatures of 15.6 and 43.3 C (60 and 110) and an oil rate of 636 STm3/d (4000 STB/day)
Figure 3 presents the bubble point pressure of the feed to the gathering line at the average line temperatures of 15.6 and 41.7 (60 and 107) as a function of solution gas. This figure indicates that for the nominal line pressure of 6900 kPa (1000 psig), the crude oil is under saturated up to GOR of 51.8 Sm3/STm3 (290.5 scf/STB) for the lower average line temperature. Similarly it shows oil is under saturated up to GOR of 39.4 Sm3/STm3 (221.3 scf/STB) for the higher average line temperature. For GOR greater than these values, the oil becomes saturated with gas and gas breaks out. The system becomes two phase gas and liquid flow.
Figure 4 presents the line pressure drop per unit length as a function of oil stock tank volume rate, GOR, and feed temperature. In this figure and subsequent figures, the solid lines are for the feed temperature of 15.6°C (60°F) and symbols are for feed temperature of 43.3°C (107°F). Figure 4 indicates that as the GOR increases from 0 to 35.7 Sm3/STm3 (0 to 200 scf/STB), the pressure drop decreases but increases with further increase in GOR of 89 Sm3/STm3 (500 scf/STB) and higher. The dividing point is at a saturation solution gas of 39.4 Sm3/STm3 (221.3 scf/STB) and 51.8 Sm3/STm3 (290.5 scf/STB) for temperatures of 41.7°C (104°F) and 15.6°C (60°F), respectively. At higher temperature the increase of GOR reduces the pressure drop when solution gas is under saturated but increases the pressure drop for GOR greater than the saturated solution gas.
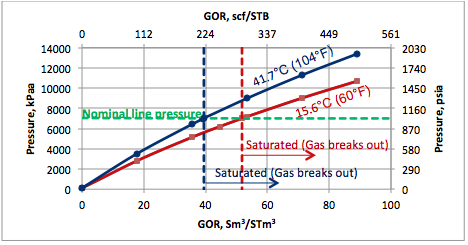
Figure 3. Bubble point pressure of the feed to the gathering line as a function of solution gas at nominal line temperature of 15.6 and 41.7 (60 and 107)
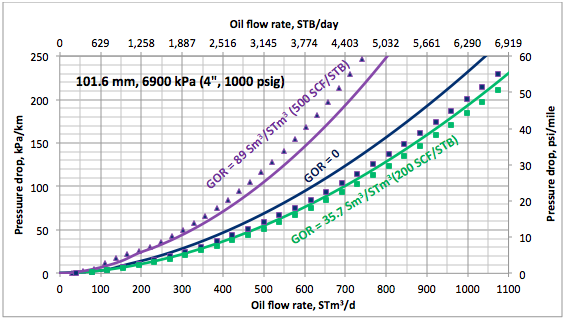
Figure 4. Variation of pressure drop per unit length with oil stock tank volume rate, GOR, and temperature – Solid curves for 15.6°C (60°F) and symbols for 43.3°C (107°F)
Figure 5 presents the variation of oil relative density along the line as a function of solution gas (RS) and temperature. This figure indicates that as the RS increases, the oil relative density decreases. Note as the temperature increases the solution gas (RS) decreases.
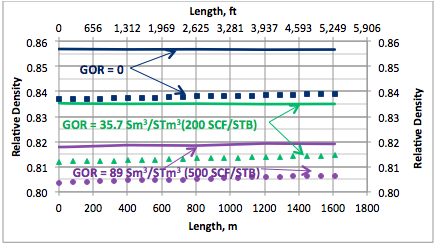
Figure 5. Variation of oil relative density with solution gas and temperature along the gathering line at 6900 kPag for 101.6 mm pipe diameter, oil rate of 636 STm3/d (4000 STB/day). Lines are for feed temperatures of 15.6 and symbols are for 43.3 C (60 and 110)
Figure 6 shows that as the RS increases, the oil viscosity decreases considerably. The reduction of viscosity causes pressure drop to decrease. The simulation results (Figure 3) indicated that for GOR less than 51.8 Sm3/STm3 (290.5 scf/STB) at 15.6°C (60°F) or 39.4 Sm3/STm3 (221.3 scf/STB) at 41.7°C (104°F), the flow is under saturated single liquid phase; however, for higher GOR the flow becomes saturated two phase (gas and liquid) which causes the pressure drop to increase. The increase in pressure drop due to higher GOR (and higher total flow rate) is more than the decrease in pressure drop due to reduction of oil viscosity as a result of solution gas. The net effect is higher pressure drop compared to dead oil (GOR = 0) pressure drop. This figure also indicates that at zero and low GOR, in which the system is single liquid phase, the temperature has a larger impact on the crude oil viscosity.
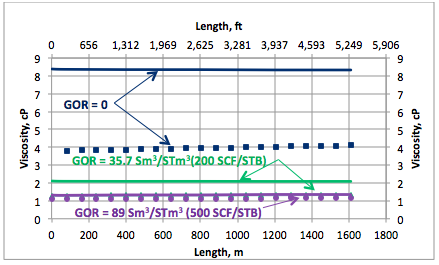
Figure 6. Variation of oil viscosity with solution gas, along the gathering line at 6900 kPag for 101.6 mm pipe diameter, oil rate of 636 STm3/d (4000 STB/day). Lines are for feed temperatures of 15.6 and symbols are for 43.3 (60 and 110)
Figure 7 presents the variation of oil and gas velocity for two stock tank oil rates and two feed temperatures along the gathering line at 6900 kPag for 101.6 mm pipe diameter and GOR of 89.1 Sm3/STm3 (500 scf/STB). The lines are for temperature of 15.6 and symbols are for temperature of 43.3 C (60 and 110). Figure 7 indicates that the oil velocity remains constant along the line but the gas velocity increases due to pressure drop in the line and more gas coming out of the solution. This figure also indicates that the impact of temperature on gas velocity is more than on the liquid phase velocity.
Figure 8 presents the impact of GOR and temperature on pressure drop along the gathering line at 6900 kPag for 101.6 mm pipe diameter and an oil rate of 636 STm3/d (4000 STB/day).
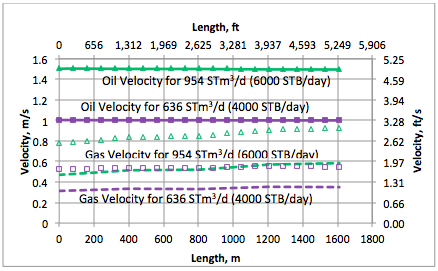
Figure 7. Variation of oil and gas velocity for two stock tank oil rate along the gathering line at 6900 kPag for 101.6 mm pipe diameter and GOR of 89 Sm3/STm3 (500 scf/STB). Lines are for feed temperatures of 15.6 and symbols are for 43.3 C (60 and 110)
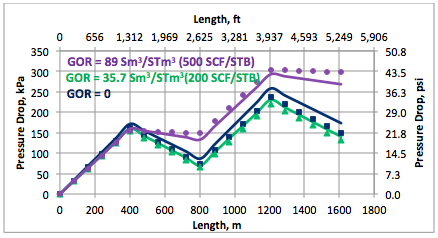
Figure 8. Impact of GOR, Sm3/STm3 (scf/STB) on pressure drop along the gathering line at 6900 kPag for 101.6 mm pipe diameter, oil rate of 636 STm3/d (4000 STB/day). Lines are for feed temperatures of 15.6 and symbols are for 43.3 C (60 and 110)
As can be seen in this figure, for GOR less than saturation GOR, the pressure drop decreases as GOR increases but for GOR greater than saturation GOR, due to presence of two phase flow, the pressure drop increases. It also shows that for GOR less than saturation, increase in temperature reduces the pressure drop but for GOR greater than saturation, the increase in temperature increases the pressure drop.
Conclusions
The following conclusions can be made based on this case study:
- For under saturated oil, the increase in temperature reduces oil density, viscosity and pressure drop. For saturated oil, the increase in temperature increases pressure drop due to increased free gas volumes.
- Even though increasing temperature reduces the solution gas, it reduces the viscosity of under saturated crude oil but its impact on saturated liquid viscosity diminishes. Increasing temperature decreases the viscosity of crude oil but it also decreases the gas in solution. The two effects can diminish the effect of temperature on viscosity.
- The impact of temperature on gas velocity is higher than its impact on liquid velocity.
To learn more about similar cases and how to minimize operational problems, we suggest attending our PF 45 (Onshore Gas Gathering Systems: Design and Operation), G4 (Gas Conditioning and Processing), PF81 (CO2 Surface Facilities), PF4 (Oil Production and Processing Facilities), and PL4 (Fundamentals of Onshore and Offshore Pipeline Systems) courses.
John M. Campbell Consulting (JMCC) offers consulting expertise on this subject and many others. For more information about the services JMCC provides, visit our website at www.jmcampbellconsulting.com, or email us at consulting@jmcampbell.com.
By: Mahmood Moshfeghian
Reference:
- Campbell, J.M., Gas Conditioning and Processing, Volume 1: The Basic Principles, 9th Edition, 2nd Printing, Editors Hubbard, R. and Snow–McGregor, K., Campbell Petroleum Series, Norman, Oklahoma, 2014.
- Moshfeghian, M., Maddox, R.N., and A.H. Johannes, “Application of Exponential Decay Distribution of C6+ Cut for Lean Natural Gas Phase Envelope,” J. of Chem. Engr. Japan, Vol 39, No 4, pp.375-382 (2006)
- ProMax 3.2, Bryan Research and Engineering, Inc., Bryan, Texas, 2014.
- Soave, G., Eng. Sci. Vol. 27, No. 6, p. 1197, 1972.
- Brill, J. P., et al., “Analysis of Two-Phase Tests in Large-Diameter Flow Lines in Prudhoe Bay Field,” SPE Jour, 363-78, June 1981.

Please update me the course Detail
Which course?
Pls send Campbeel TOM by e-mail or norify us about updates. Thank you.
Together with the whole thing that seems to be developing within this specific subject material, your opinions are generally rather refreshing. Nonetheless, I appologize, but I can not give credence to your whole strategy, all be it exciting none the less. It looks to everyone that your opinions are generally not entirely justified and in reality you are yourself not even completely confident of the assertion. In any case I did enjoy reading it.
Great tips!
My family always say that I am killing my time
here at net, however I know I am getting knowledge everyday
by reading thes nice articles or reviews.
Hmm it seems like your site ate my first comment (it was super long) so I guess I’ll just sum it up what I submitted and say, I’m thoroughly enjoying your blog.
I as well am an aspiring blog blogger but I’m still new to the whole thing.
Do you have any tips for beginner blog writers?
I’d really appreciate it.