This tip will investigate the benefits of having a water-draw in a condensate stabilizer. It will use a commercial simulation software to simulate the performance of an operating stabilizer. In order to take into account the non-ideality of water, the tip will perform three-phase (vapor, liquid hydrocarbon, and aqueous phases) calculations on the trays with excessive water rates. Specifically, it will study the impact of feed water rate in the raw condensate stream on the reboiler and condenser duties. It will also study water removal by water-draw pan, and the optimum location of water-draw tray in the column. For a case study the tip will determine the optimum location of water-Draw tray by maximizing water removal from water-draw tray and minimizing the reboiler and condenser duties.
If the vapor – liquid equilibrium conditions in the distillation tower allow the water entering the column with the feed to leave in either the bottom product or in the overhead distillate product, then no special provisions are needed to remove the water from the fractionator. A key exception here is the probability of free water accompanying the feed stream due a malfunctioning upstream three-phase feed separator. If the distillate product is a liquid and the water condenses along with the distillate and reflux streams then the overhead accumulator can be configured as a three-phase separator. A more difficult situation exists if the water condenses within the tower because the overhead temperature is too cool and the bottoms temperature is too hot to allow the water to leave in the product streams. The most common example of this condition is found in the condensate stabilizer.
Liquid water build-up can reduce capacity and, depending on the fluid composition, promote corrosion. Eventually the water build-up will cause the tower to flood and a major disruption in tower operation results as the water leaves the column. Once the water has left the column, operation will return to normal until the cycle repeats and the water build-up once again produces a flooding condition. The time between cycles can be anywhere from hours to weeks depending on the amount of water entering the stabilizer.
One solution to the water build-up condition is to provide a water draw pan on the trays where liquid water is expected to condense. Figure 1 [1] is an example of a water draw for a tray-distillation column. The water draw pan is not sized to provide a good separation between water and hydrocarbon liquid so the fluid leaving the column is routed to an adequately sized liquid-liquid separator where the water is removed for further processing and the hydrocarbon liquid is routed back to the distillation column [2].
![Figure 1. Water Draw Tray Arrangement [1]](http://www.jmcampbell.com/tip-of-the-month/wp-content/uploads/2016/04/Fig1.png)
Figure 1. Water Draw Tray Arrangement [1]
Case Study
Table 1 presents the compositions (mol %) of a raw condensate mixture studied. This table also presents the required heavy end properties (Molecular Weight, Specific Gravity, and Volume Average Boiling Point) and the conditions of the feed stream.
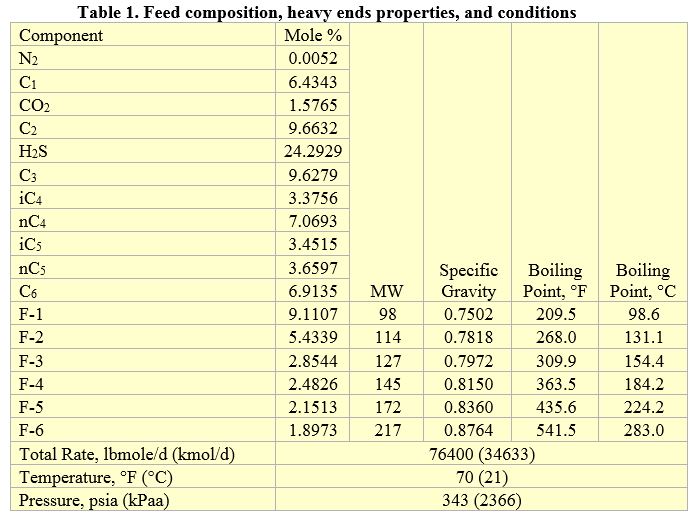
Figure 2 presents a simplified process flow diagram for the case study. The tip utilized the front mixer to vary the feed water rate for the simulation purpose only. The use of the heat exchanger (HEX) will lower the reboiler and condenser duties. Table 2 presents the stabilizer column specifications. Note the difference between water draw from within the column and water drain from the V-4 reflux drum.
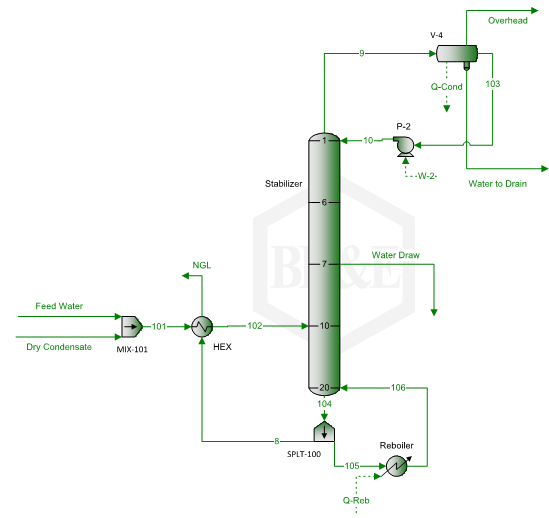
Figure 2. A simplified stabilizer column with side water-draw
Based on the information in Tables 1 and 2, and the process flow diagram of Figure 2, the tip performed simulation using the Soave-Redlich-Kwong (SRK) equation of state [3] in ProMax [4] software.
Simulation Results:
Figure 3 present the simulation results for the base case without side water-draw. The total water rate on the x-axis represents the sum of water rates in the vapor, light liquid (mostly hydrocarbons), and heavy liquid (mostly water) phases at any given tray in the column. The feed water range is from 940 to 1500 lbmole/d (427 to 1500 kmol/d). If the feed water is less than 940 lbmole (427 kmol/d) no heavy liquid (aqueous) phase is formed inside the column and water side draw rate will be zero. Figure 3 indicates if the feed water rate increases above 1200 lbmole/d (545 kmol/d), the maximum total water rate location shifts from tray 11 down to 18. In an actual plant a free water knockout drum (three-phase separator) ahead of the stabilizer removes the excess water to minimize the heating requirement. The feed water rate above 1200 lbmole/d (545 kmol/d) to the stabilizer column is unrealistic and shown here only for demonstration purposes.
In addition to the base case, the tip simulated two cases with the side water-draw located at tray number 7 or 8. Table 3 presents the summary of simulation results for the base case and the two cases with side water-draw. For the base case without the water draw, at higher feed water rate some of the water leaves with stabilized condensate (C5+).
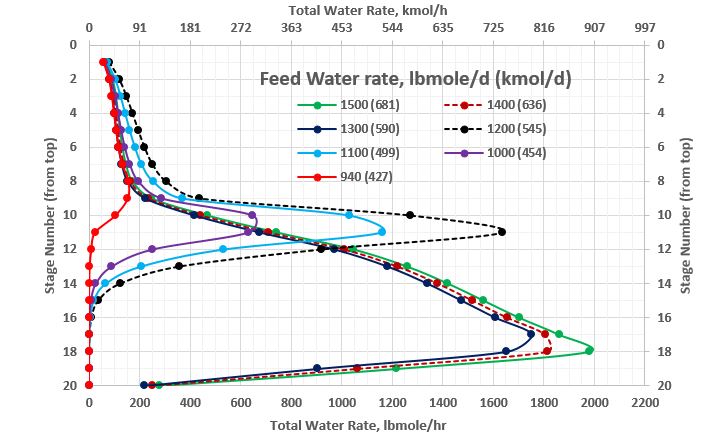
Figure 3. Total water molar rate profile in the stabilizer column without side water-draw as a function water rate in the feed
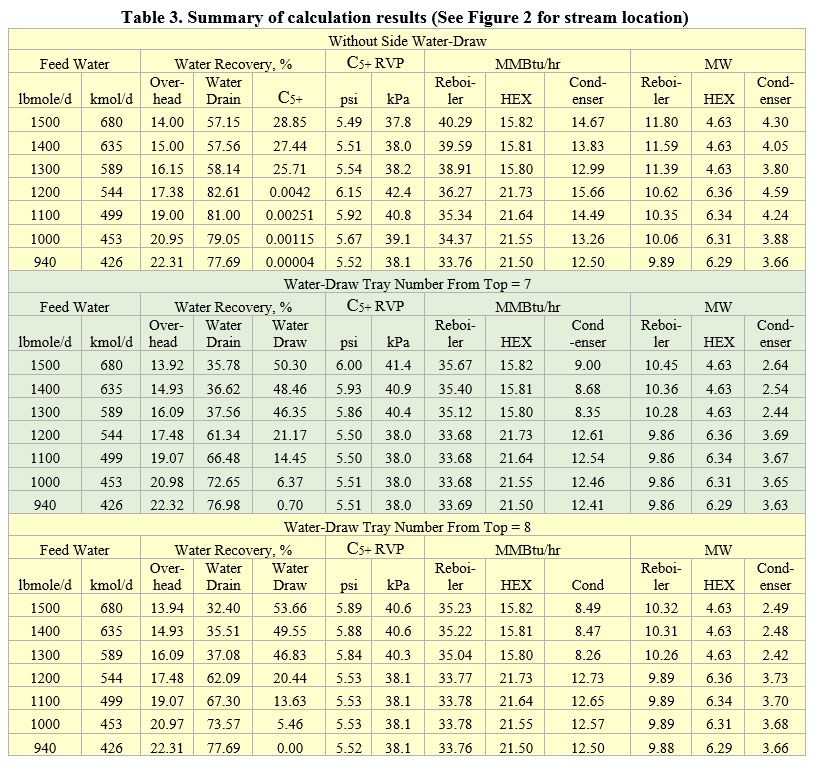
Figure 4a indicates that the presence of side water-draw at tray 7 shifts the maximum total water rate from tray 10 (Figure 3) to 6 for lower feed water rates and from tray 18 (Figure 3) to 10 for higher feed water rates, respectively. Figures 4a and 4b also indicate that the side water-draw at tray 7 removes water effectively for low feed water rates. As shown in Table 3, at higher feed water rate, the reboiler and condenser duties decrease considerably compared to the base case. Table 3 also indicates that the HEX (feed-bottoms exchanger) duty remains the same for all three cases because there was no material change in its flows and temperatures.
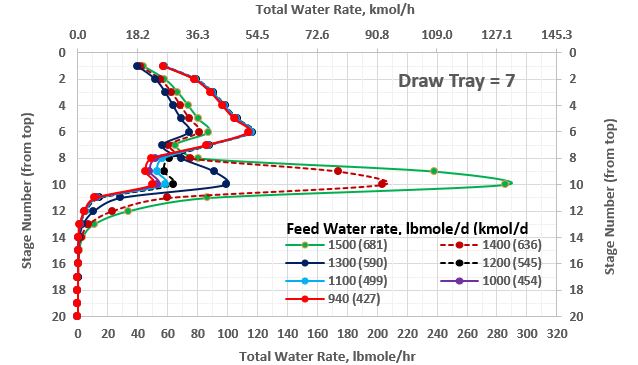
Figure 4a. Total water molar rate profile in the stabilizer column with side water-draw at tray 7 as a function water rate in the feed (full range)
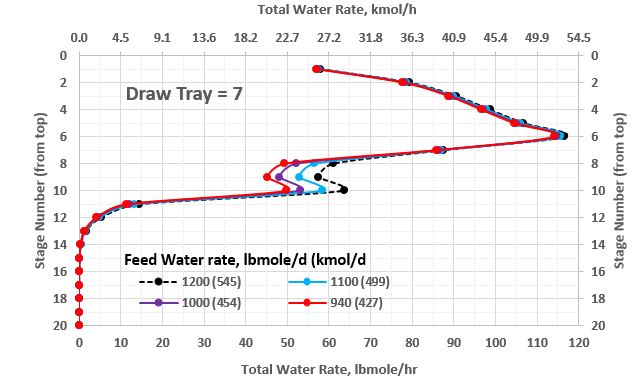
Figure 4b. Total water molar rate profile in the stabilizer column with side water-draw at tray 7 as a function water rate in the feed (lower range)
In order to maximize water removal for higher feed water rate, the tip moved the side water-draw from tray 7 to 8. Table 3 clearly indicates that water-draw at tray 7 give higher water recovery percent for lower feed water rates up to 1200 lbmole/d (545 kmol/d) and water-draw at tray 8 give higher water recovery for higher feed water rate. Figure 5 presents the total water flow rate profile within the column with side water-draw at tray 8 as a function of feed water rate. This figure demonstrates the effectiveness of the side water-draw.
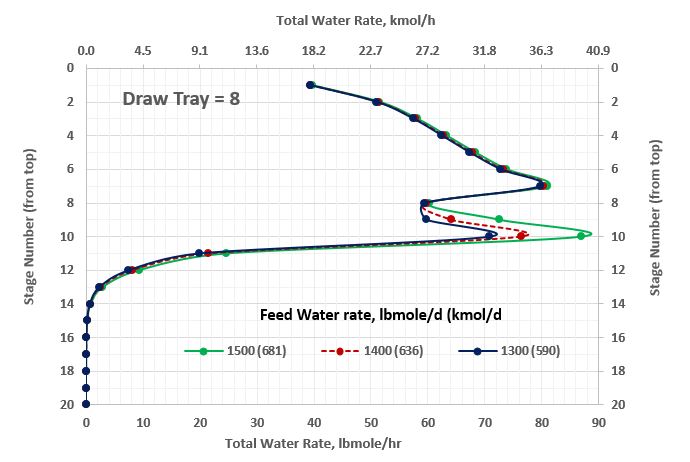
Figure 5. Total water molar rate profile in the stabilizer column with side water-draw at tray 8 as a function water rate in the feed (higher range)
Figure 6 presents the water recovery percent of the feed water as a function of the feed water rate for the three cases considered. For the base case without the side water-draw some of the excess water leaves the column with the C5+ stream. For this case, the excess feed water rate also increases the reboiler and condenser duties. These increases are indicative of the increased internal vapor traffic necessary to carry the water vapor out of the tower.
Like Figures 7 and 8, Figure 6 also shows the effectiveness of side water-draw and the impact of side water-draw location.
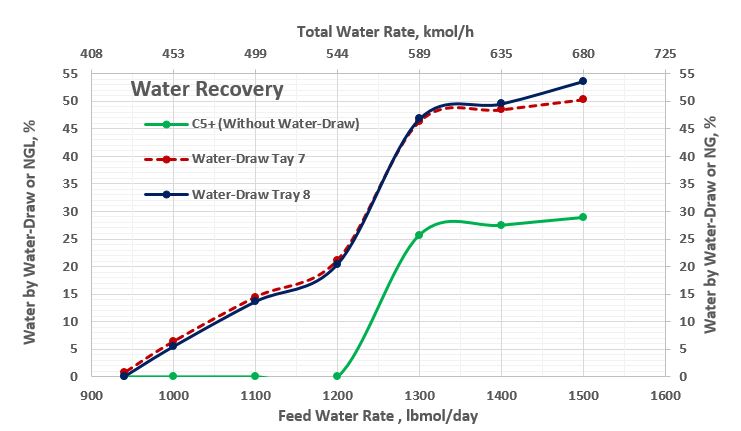
Figure 6. Water recovery (%) as a function of the feed water rate
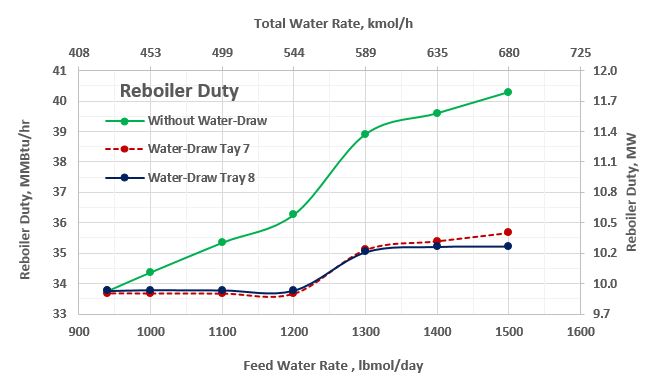
Figure 7. Reboiler duty as a function of the feed water rate
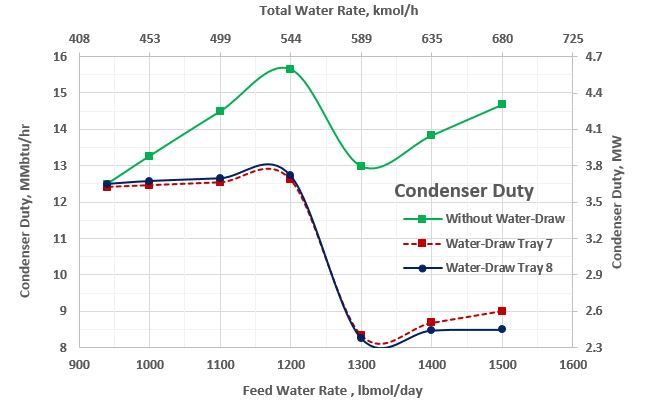
Figure 8. Condenser duty as a function of the feed water rate
Conclusions:
The simulation results for the three case studies demonstrated the effectiveness of side water-draw and the importance of water draw location in the column. Based on the results obtained, this tip presents the following observations.
- Commercial simulators using special convergence algorithms and thermodynamic packages are able to predict the presence of two liquid phases within distillation columns. The calculations are difficult to converge and it is difficult to predict the exact location of the liquid water phase. Therefore, it is advisable to install liquid water draw trays in two or three locations around the tray predicted by the simulator.
- Install properly sized free water knockout (three phase separator) separator to minimize the feed water rate to the stabilizer column. This assures easier/less troublesome operation with lower utility (reboiler and condenser duties) cost.
- Side water-draw removes water/aqueous phase effectively and reduces the reboiler duty and condenser duty.
- The optimum location of the side-draw depends on the feed water rate.
- This tip determined the optimum location of water-draw try by maximizing liquid water removal and minimizing the reboiler and condenser duties.
- The side water-draw has no impact on the heat exchanger upstream of the stabilizer column.
- As shown In Table 3, the topmost condenser duties for the three cases are 14.67, 9.00 and 8.49 MMBtu/hr (4.3, 2.64, and 2.49 MW), respectively. Since fundamentally at a fixed overhead product rate, condenser pressure and temperature the water vapor content is fixed. Thus a greater total overhead flow is needed to transport water as vapor out of the column to be condensed into the reflux drum and removed. Greater total overhead means larger condenser duty. It also requires a commensurately larger reboiler duty. With a lot of water entering the tower the condenser and reboiler might not be big enough to do the job.
Part 2 (follow-up of this tip) will investigate the variation of water partial pressure along the column and the changes in operating variables.
To learn more about similar cases and how to minimize operational problems, we suggest attending our G4 (Gas Conditioning and Processing), G5 (Advanced Applications in Gas Processing), P81 (CO2 Surface Facilities), and PF4 (Oil Production and Processing Facilities), courses.
PetroSkills offers consulting expertise on this subject and many others. For more information about these services, visit our website at http://petroskills.com/consulting, or email us at consulting@PetroSkills.com.
By: Dr. Mahmood Moshfeghian
Reference:
- Campbell, J.M., Gas Conditioning and Processing, Volume 2: The Equipment Modules, 9th Edition, 2nd Printing, Editors Hubbard, R. and Snow–McGregor, K., Campbell Petroleum Series, Norman, Oklahoma, 2014.
- Lieberman, N. P. ; “Troubleshooting Process Operation – 13,” Oil and Gas Journal, p. 100– 102, Feb 16, 1981.
- Soave, G., Chem. Eng. Sci. 27, 1197-1203, 1972.
- ProMax 3.2, Bryan Research and Engineering, Inc, Bryan, Texas, 2016.

[…] tip is the follow up to the April 2016 Tip of the Month (TOTM) which investigated the benefits of having a water-draw in a condensate stabilizer column. It will […]
What are splt-100 specifications? is it like Hysys splitter?
Ivan:
Yes, Split-100 is a stream splitter.
76.5 % of stream 104 goes to stream 105 and the rest goes to stream 8.
[…] previo será un seguimiento del previo de Abril 2016, el cual investigó los beneficios de tener una corriente lateral en una columna estabilizadora. Se […]
[…] M., April 2016 tip of the month, PetroSkills | John M. Campbell, […]