Similar to the gas-sweetening process, the methyldiethanolamine (MDEA) liquid-sweetening process removes a considerable amount of methanol from a sour NGL (Natural Gas Liquid) stream. Moreover, if the methanol content of the sour NGL is high, the sweetened NGL may still retain high methanol content and can cause operational troubles in the downstream processes. Provisions of purging reflux (Water Draw) of the regenerator column and its replacement with “Fresh Water” can improve methanol recovery [1, 2].
The August 2016 tip of the month (TOTM) considered the presence of methanol in the sour NGL stream and determined the quantitative traces of methanol ending up in the sweet NGL, flash gas and acid gas streams [2]. It simulated a simplified MDEA liquid-sweetening unit by computer and studied the effect of sour NGL methanol content, and the rate of replacing condensed reflux with fresh water on the sweet NGL methanol content. For the sour NGL temperature of 26.7 °C (80 °F) the tip studied five inlet NGL methanol contents of 50, 250, 500, 1000, and 1500 PPM on mole basis (30, 149, 298, 596, 894 PPMw, weight basis). In each case the tip varied the rate of fresh water replacement from 0 to 100 % by an increment of 20%. Table 1 presents the summary of calculated methanol removal efficiency (MRE).
![Table 1. The effect of purging and circulation rate on the methanol removal efficiency [2]](http://www.jmcampbell.com/tip-of-the-month/wp-content/uploads/2016/09/table1.jpg)
Table 1. The effect of purging and circulation rate on the methanol removal efficiency [2]
In continuation of the August 2016 TOTM, this tip will consider the presence of methanol in the sour NGL stream and determine the quantitative traces of methanol ending up in the sweet NGL, flash gas and acid gas streams. This tip simulates a simplified MDEA liquid-sweetening unit by computer simulation [3, 4]. This tip also studies the effect of sour NGL methanol content, temperature and the rate of replacing condensed reflux with fresh water on the sweet NGL methanol content.
For the sour NGL temperatures of 21.1, 26.7, 37.8 °C (70, 80, 100 °F) the tip studies five inlet NGL methanol contents of 50, 250, 500, 1000, and 1500 PPM on mole basis (30, 149, 298, 596, 894 PPMw, weight basis). In each case the tip varies the rate of fresh water replacement from 0 to 100 % by an increment of 20%. Based on the computer simulation results, the tip develops simple charts and correlations to estimate the methanol removal efficiency under various operating conditions. These charts and correlations are accurate enough for facilities calculations.
Case Study:
For the purpose of illustration, this tip considers sweetening of a sour NGL stream using the basic and modified MDEA processes as described in the August 2016 TOTM [2]. Table 2 presents its composition, standard liquid volume rates, pressure, and temperatures. This tip uses ProMax [5] simulation software with the “Amine Sweetening – PR” property package to perform all of the simulations. Specifications/assumptions are also the same as in the August 2016 TOTM [2].
![Table 2. Feed composition, volumetric flow rate and conditions [2]](http://www.jmcampbell.com/tip-of-the-month/wp-content/uploads/2016/09/table2.jpg)
Table 2. Feed composition, volumetric flow rate and conditions [2]
Results and Discussions:
Figure 1 presents the calculated methanol removal efficiency as a function of the ratio of the lean MDEA rate to the sour NGL rate for the five sour NGL methanol contents (30, 149, 298, 596, 894 PPMw, weight basis). The sour NGL temperature is 26.7 °C (80 °F).
The methanol removal efficiency (MRE) on the weight basis is defined by:

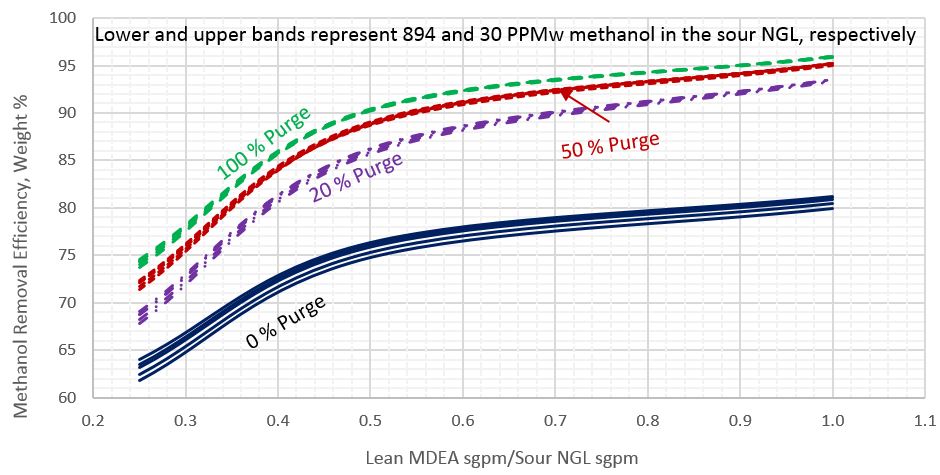
Figure 1. Methanol removal efficiency vs circulation ratio of lean MDEA Sm3/h (sgpm) to sour NGL Sm3/h (sgpm) for sour NGL temperature of 26.7 °C (80 °F)
This figure indicates that as the percentage of purge increases the impact of the sour NGL methanol content diminishes. Similar diagrams were generated for sour NGL temperatures of 21.1 and 37.8 °C (70 and 100 °F). For simplicity, for each percent of purge the arithmetic average of each family of the curves was calculated and plotted in the subsequent figures.
For each sour NGL temperature, each percentage of reflux purge, and each lean MDEA rate, the arithmetic average of methanol removal efficiencies for the five sour NGL methanol content was calculated. Figures 2 through 4 present these calculated average methanol removal efficiencies as a function of the circulation ratio of the lean MDEA rate to the sour NGL rate for the sour NGL temperatures of 21.1, 26.7, and 37.8 °C (70, 80, and 100 °F), respectively. Each figure presents four curves for 0, 20, 50, and 100% reflux purge. The symbols in these figures present the arithmetic average of calculated methanol removal efficiency (MRE) by ProMax and all of the lines were generated by regression of the ProMax calculated MRE.
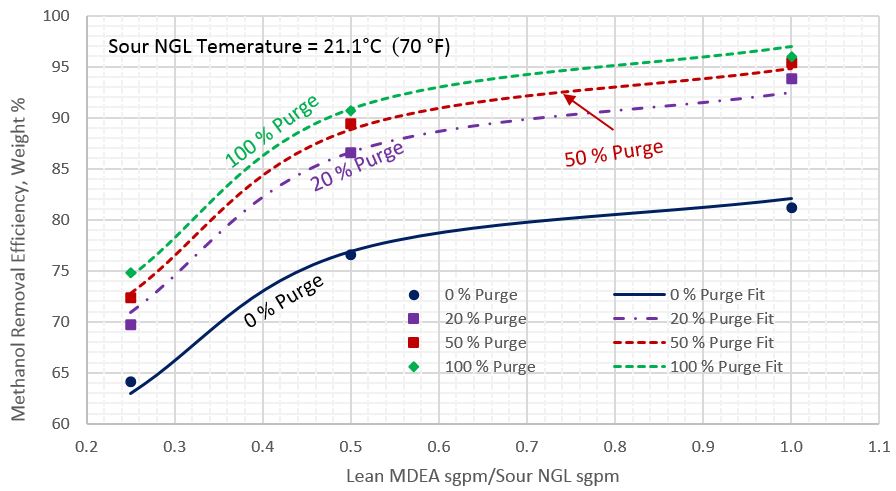
Figure 2. Average methanol removal efficiency vs circulation ratio of lean MDEA Sm3/h (sgpm) to sour NGL Sm3/h (sgpm) for sour NGL temperature of 21.1 °C (70 °F)
A non-linear regression program was used to determine the parameters of the following correlation for the methanol removal efficiency as a function of the circulation ratio (CR) and the reflux purge % (RP).
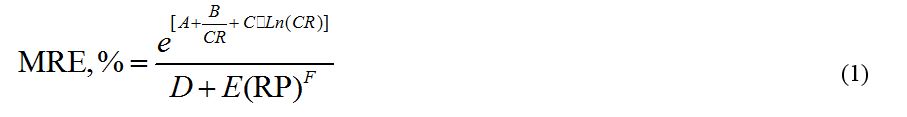
Where:
MRE = Methanol removal efficiency on the weight basis
CR = Circulation ratio, Sm3/h of MDEA / Sm3/h of sour NGL (sgpm/sgpm)
RP = Reflux purge %
Table 3 presents the regressed parameters of A through F of Equation 1 for the three considered sour NGL temperatures. The last two rows in Table 3 present the Average Absolute Percent Error (AAPE) and the Maximum Absolute Percent Error (MAPE), respectively. The analysis of Figures 2 through 4 and the calculated values of AAPE and MAPE indicate that accuracy of the proposed correlations is very good for estimation of methanol removal efficiency (MRE).
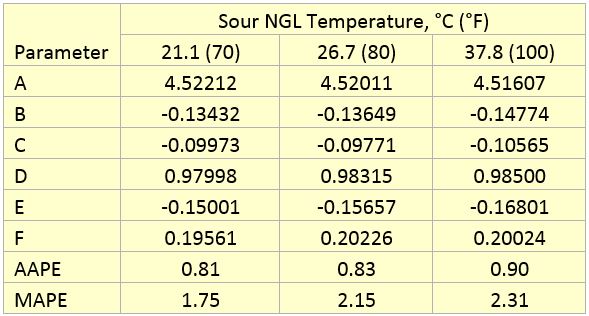
Table 3. Parameters of Equation 1 for methanol removal efficiency
AAPE = Average Absolute Percent Error
MAPE = Maximum Absolute Percent Error
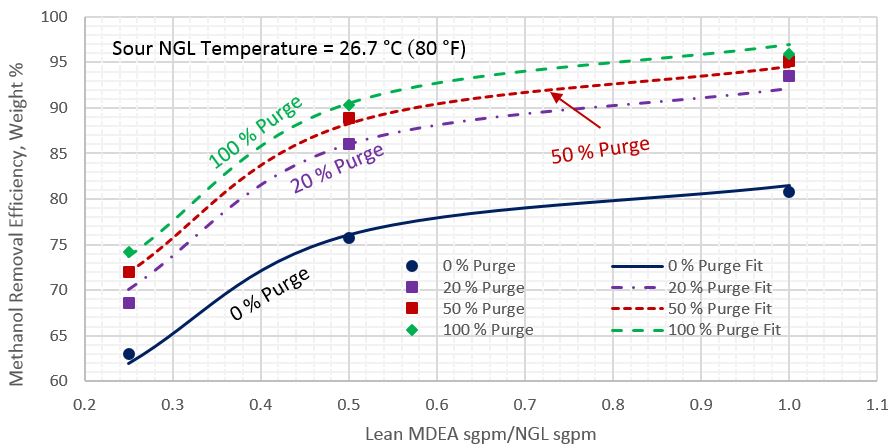
Figure 3. Average methanol removal efficiency vs circulation ratio of lean MDEA Sm3/h (sgpm) to sour NGL Sm3/h (sgpm) for sour NGL temperature of 26.7 °C (80 °F)
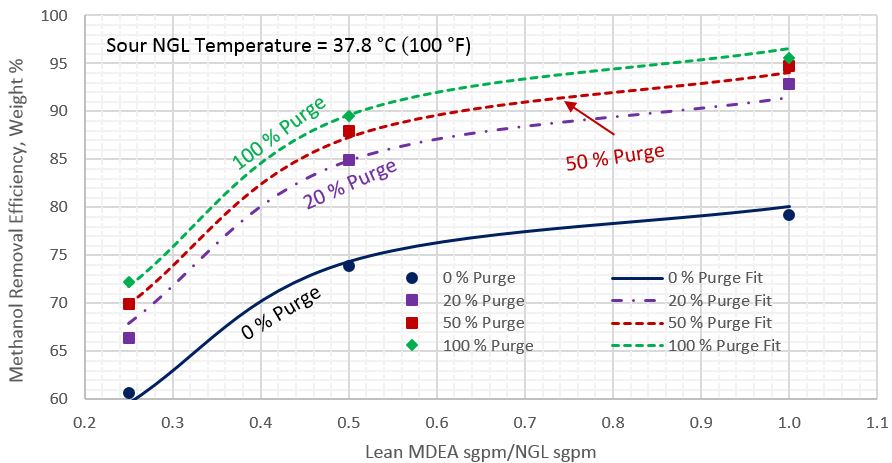
Figure 4. Average methanol removal efficiency vs ratio circulation of lean MDEA Sm3/h (sgpm) to sour NGL Sm3/h (sgpm) for sour NGL temperature of 37.8 °C (100 °F)
Conclusions:
Based on the results obtained for the considered case study, this TOTM presents the following conclusions:
- As the circulation ratio increases, the impact on the methanol removal efficiency diminishes. A ratio of about 0.5 appears to provide a reasonable breakpoint.
- As the percentage of reflux purge increases, the impact of the sour NGL methanol content on the methanol removal efficiency diminishes (Figure 1), overall only a minor impact, 2 to 3% points.
- As the sour NGL temperature increases, the methanol removal efficiency decreases (Figures 2-4), overall only minor impact, 2 to 3% points.
- Methanol removal efficiency with MDEA sweetening can remove only 95-97% of the methanol in the sour NGL feed. This may still leave more methanol than the NGL spec allows. A separate water wash step may be required. The fresh water used for the water wash could be recycled as MDEA reflux purge make-up.
- The tip presents three simple charts (Figures 2-4) and a correlation (Equation 1) along with its parameters (Table 3) for estimating the average methanol removal efficiencies of the sour NGL temperatures of 21.1, 26.7, and 37.8 °C (70, 80, and 100 °F), respectively.
- Compared to the rigorous computer simulation, the accuracy of the proposed correlation (Equation 1) to estimate the average methanol removal efficiency is very good (Table 3) and can be used for facilities calculations.
- The proposed correlation (Equation 1) and charts (Figures 2-4) are easy to use.
To learn more about similar cases and how to minimize operational troubles, we suggest attending our G6 (Gas Treating and Sulfur Recovery), G4 (Gas Conditioning and Processing), G5 (Advanced Applications in Gas Processing), and PF4 (Oil Production and Processing Facilities) courses.
PetroSkills | Campbell offers consulting expertise on this subject and many others. For more information about these services, visit our website at http://petroskills.com/consulting, or email us at consulting@PetroSkills.com.
By: Dr. Mahmood Moshfeghian
References:
- O’Brien, D., Mejorada, J., Addington, L., “Adjusting Gas Treatment Strategies to Resolve Methanol Issues,” Proceedings of Lawrence Reid Gas Conditioning Conference, Norman, Oklahoma, 2016.
- Moshfeghian, M., August 2016 tip of the month, PetroSkills | John M. Campbell, 2016.
- Maddox, R.N., and Morgan, D.J., Gas Conditioning and Processing, Volume 4: Gas treating and sulfur Recovery, Campbell Petroleum Series, Norman, Oklahoma, 1998.
- Campbell, J.M., Gas Conditioning and Processing, Volume 2: The Equipment Modules, 9th Edition, 1st Printing, Editors Hubbard, R. and Snow –McGregor, K., Campbell Petroleum Series, Norman, Oklahoma, 2014.
ProMax 4.0, Bryan Research and Engineering, Inc., Bryan, Texas, 2016.

Subscripe for MTOM
[…] M., September 2016 tip of the month, PetroSkills | John M. Campbell, […]