The TEG (triethylene glycol) gas dehydration process removes a considerable amount of methanol from a wet gas stream. if the methanol content of the wet gas is high, the dry gas may still retain high methanol content and can cause operational troubles in the downstream processes.
Continuing the October 2010 tip of the month (TOTM), in this TOTM we will consider the presence of methanol in the produced oil/water/gas stream and determine the quantitative traces of methanol ending up in the TEG dehydrated gas. To achieve this, we simulated by computer an offshore production facility consisting of oil/water/gas multistage-separation, compression and TEG dehydration processes and determined the methanol concentration in the dried gas. We also studied the effect of wet gas temperature and pressure, the number of theoretical trays in the TEG contactor, the water content spec of dry gas, and lean TEG solution circulation rate on the dried gas methanol content. For this purpose, methanol content in the production stream was assumed to vary from zero to 350 PPM (V).
Based on the computer simulation results, the tip develops simple charts and correlations to estimate the methanol removal efficiency in a TEG contactor column under various operating conditions. These charts and correlations are accurate enough for facilities calculations.
Case Study:
The same case study presented in the October 2010 TOTM is used to study the methanol removal in a TEG contactor column. A simplified process flow diagram (PFD) for the offshore production facility is shown in Figure 1 [1]. The production stream (oil, water, gas, and methanol) was passed through the high pressure separator where free water and gas were separated and the oil was passed through the intermediate and low pressure separators for subsequent gas separation from oil. The separator’s off gas streams were recompressed and cooled to 4830 kPa and 35 °C (700 psia and 95 °F) before entering the TEG contactor for dehydration. The dried gas was compressed further (not shown in the PFD) to 23200 kPa (3365 psia) for reinjection or export purposes. To meet a water content spec of 32 mg/Sm3 (2 lbm/MMscf) or lower, a lean TEG concentration of 99.95 weight percent was used in all of the simulation runs. This tip uses ProMax [2] simulation software with the “PR EOS” property package to perform all of the simulations.
To study the impact of methanol (MeOH) concentration and determine the traces in the TEG dehydrated gas, the MeOH content of the production stream feed to the high pressure separator was assumed to vary from 0 to 350 PPM (V). This variation of MeOH content was chosen due to the uncertainty of its concentration in the production stream. The wet compressed gas temperature is an important parameter in the operation of a TEG unit and affects the water content of dried gas and the required lean TEG solution circulation rate and/or the number of required theoretical trays in the contactor. Depending on the design and/or operational problem like scaling on the cooling side of the gas cooler, the wet gas temperature may be higher than 35 °C (95 °F). Therefore, the wet gas temperature was assumed to vary from 35 to 50 °C with 5 °C increments (95 to 122 °F and 9 °F increment). Depending on the requirement, 2 or 3 theroetical trays (xtheoreticalx) were (xwasx) used in the contactor unit. For each case the lean TEG solution rate was varied to meet the desired water content specification for each case.
To study the impact of pressure, in addition to pressure of 4830 kPa (700 psia), a wet gas pressure of 7000 kPa (1015 psia) was also used.
For each simulation run, the methanol removal efficiency (MRE) was calculated by the following equation.

![Figure 1. Simple process flow diagram used in this case study [1]](http://www.jmcampbell.com/tip-of-the-month/wp-content/uploads/2016/11/fig1.jpg)
Figure 1. Simple process flow diagram used in this case study [1]
Results and Discussions:
Table 1 shows sample calculation results for two theoretical trays and wet gas pressure of 4830 kPa (700 psia) and four temperatures. For each temperature the wet gas methanol content was varied in the range of 0 to 112 PPM on molar basis. In each case, the lean TEG solution circulation rate was adjusted to meet the dry gas water content of 16 mg/Sm3 (1 lbm/MMSCF). Analysis of Table 1 indicates that for each wet gas temperature, the circulation ratio and methanol removal efficiency were independent of the wet gas methanol content. Therefore, for each wet gas temperature, the average circulation ratio and methanol removal efficiency were calculated and presented in Table 2. Similar to the results of tables 1 and 2, seven more tables were generated for 2 and 3 theoretical trays, dry gas water contents of 16 and 32 mg/Sm3 (1 and 2 lbm/MMSCF), pressures of 4830 and 7000 kPa (700 and 1015 psia).
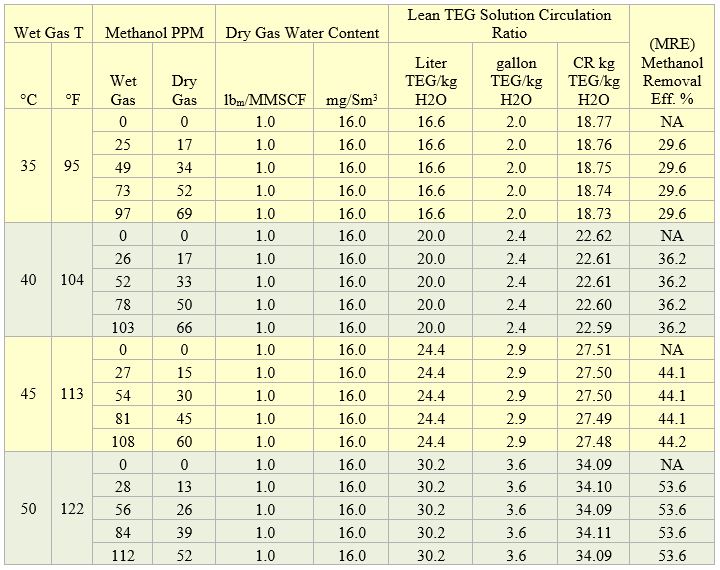
Table 1. Sample results for two theoretical trays and wet gas pressure of 4830 kPa (700 psia)
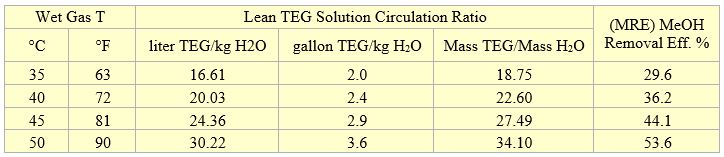
Table 2. Average results for two theoretical trays and wet gas pressure of 4830 kPa (700 psia)
The summary for all of the simulation results for methanol removal efficiency as a function of the lean TEG solution circulation ratio for 2 and 3 theoretical number of trays at two pressures, and two dry gas water content specifications are presented in Figures 2 and 3, respectively.
Analysis of Figures 2 and 3 indicates that for each pressure the results for dry gas water content of 16 and 32 mg/Sm3 (1 and 2 lbm/MMSCF) specifications follow the same trend and can be represented by a single curve. Therefore, the methanol removal efficiency as a function of the lean TEG solution circulation ratio can be expressed by a single correlation for each pressure and number of theoretical trays independent of the wet gas methanol content and temperature.
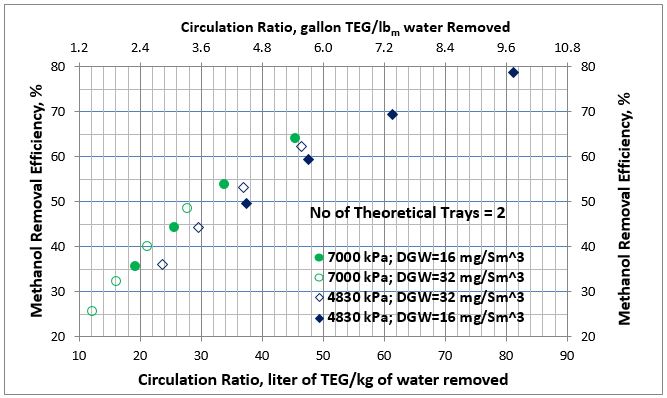
Figure 2. Average methanol removal efficiency vs circulation ratio for 2 theoretical trays
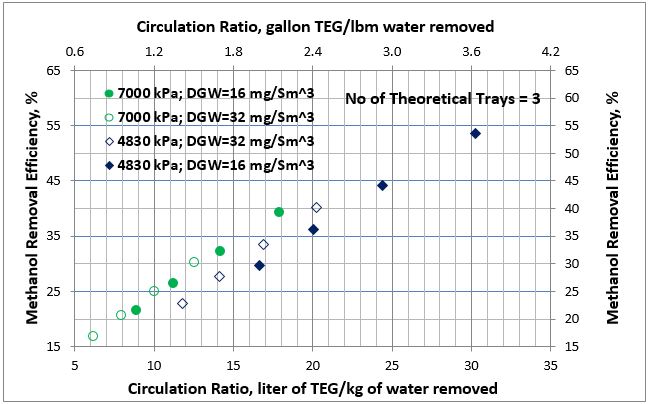
Figure 3. Average methanol removal efficiency vs circulation ratio for 3 theoretical trays
A non-linear regression program was used to determine the parameters of the following correlation for the methanol removal efficiency (MRE) as a function of the lean TEG solution circulation ratio.
![]()
Where:
MRE = Methanol Removal Efficiency on the mole basis, %
CR = Circulation ratio, liter TEG/kg water (gallon TEG/lbm water)
Table 3 presents the regressed parameters of “a” and “b” of Equation 1 for two and three theoretical trays and the wet gas pressures of 4830 and 7000 kPa (700 and 1015 psia). The last two rows in Table 3 present the Average Absolute Percent Error (AAPE) and the Maximum Absolute Percent Error (MAPE) for different units of lean TEG solution circulation rate.
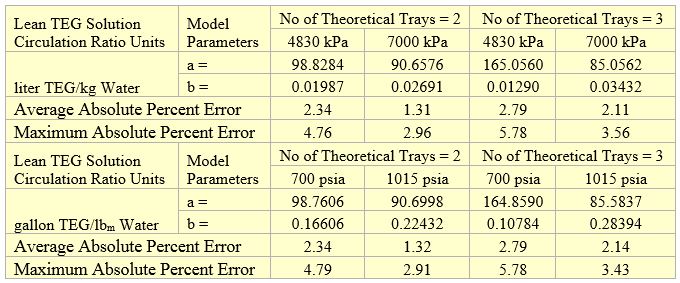
Table 3. Parameters of Equation 1 for methanol removal efficiency
The MRE predictions by Equation 1 were added to Figures 2 and 3 and are presented in Figures 4 and 5. In these two figures the solid lines present the MRE prediction by Equation 1 and symbols represent simulation results. The filled symbols represent the dry gas water content of 16 mg/Sm3 (1 lbm/MMSCF) and the no fill symbols represent the dry gas water content of 32 mg/Sm3 (32 lbm/MMSCF). The analysis of Figures 4 and 5 and the calculated low values of AAPE and MAPE in Table 3 indicate that accuracy of the proposed correlations, compared to the simulation results, is good for estimation of methanol removal efficiency (MRE).
Conclusions:
Based on the results obtained for the considered case study, this TOTM presents the following conclusions:
- The methanol removal efficiency is independent of the wet gas methanol content (Table 1).
- As the wet gas temperature increases, the lean TEG solution circulation ratio increases; therefore, methanol removal efficiency increases (Table 2). The wet gas water content is a strong function of temperature. As temperature increases, the wet gas water content increases; therefore, for a fixed number of trays the required lean TEG solution rate increases.
- As the wet gas pressure increases, the absorption of methanol increases; therefore, methanol removal efficiency increases (Figures 4 and 5). The wet gas water content is a function of pressure. As pressure increases, the wet gas water content decreases; therefore, for a fixed number of trays the required lean TEG solution rate decreases but this decrease in rate is offset by higher solubility of methanol at higher pressure.
- For the same TEG contactor number of trays and pressure, the methanol removal efficiency as a function of circulation ratio for different dry gas water specifications follows the same trend (Figures 4 and 5).
- The tip presents two simple charts (Figures 4-5) and a correlation (Equation 1) along with its parameters (Table 3) for estimating the average methanol removal efficiencies for 2 and 3 theoretical trays and pressures of 4830 and 7000 kPa (700 and 1015 psia), respectively.
- Compared to the rigorous computer simulation results, the accuracy of the proposed correlations (Equation 1, and Table 3) to estimate the average methanol removal efficiency provides good agreement to simulation results. This correlation, and Figures 4 or 5 can be used to estimate MeOH removal performance in TEG facilities operating at similar conditions.
- The proposed correlations (Equation 1) and charts (Figures 4-5) are easy to use, and provides a simple approach to estimate MeOH removal efficiency in TEG units without access to a process simulator.
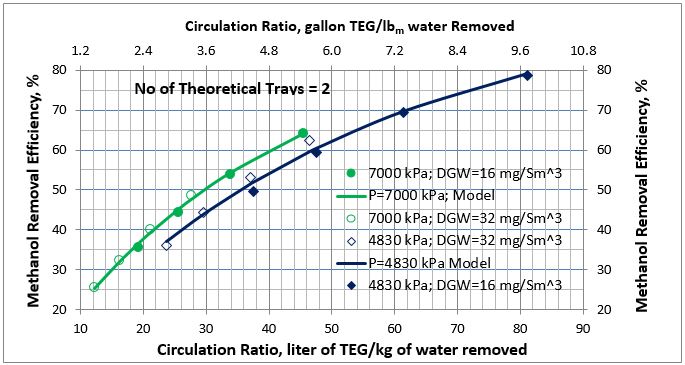
Figure 4. Average methanol removal efficiency vs circulation ratio for 2 theoretical trays
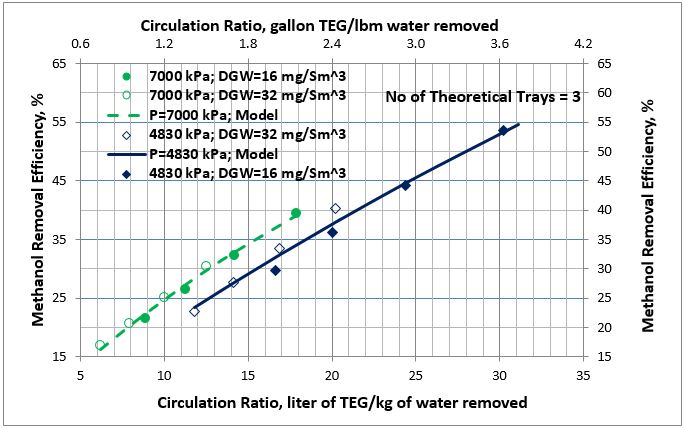
Figure 5. Average methanol removal efficiency vs circulation ratio for 3 theoretical trays
To learn more about similar cases and how to minimize operational troubles, we suggest attending our G4 (Gas Conditioning and Processing), G5 (Advanced Applications in Gas Processing), and PF4 (Oil Production and Processing Facilities) courses.
PetroSkills | Campbell offers consulting expertise on this subject and many others. For more information about these services, visit our website at http://petroskills.com/consulting, or email us at consulting@PetroSkills.com.
References:
- Moshfeghian, M., October 2010 tip of the month, PetroSkills | John M. Campbell, 2010.
- ProMax 4.0, Bryan Research and Engineering, Inc., Bryan, Texas, 2016.

.