In this Tip of the Month, we will show how to determine the optimum interstage pressure for a two-stage compression process. We will also study other operating condition such as feed temperature, heavy end in the feed, and water moisture. For this purpose, we used a commercial simulation package and the SRK EoS for the prediction of phase behavior and thermodynamic properties.

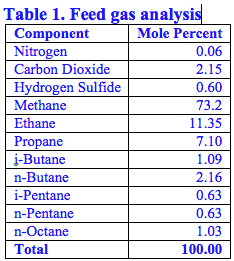
The gas mixture with the composition shown in Table1 at 37 °C (98.6 °F) and 31 bar(g) (450 psig) on a dry basis is compressed in two stages for injection into an oil field as a means of enhancing production. The process flow diagram is shown in Figure 1. The injection pressure is 131 bar (g) (1900 psig) and temperature is 65 °C (149 °F). The gas rate for stream 2 is 6.792×10⁶ std m3/d (240 MMSCFD). The suggested isentropic efficiency is 72 percent and a mechanical efficiency for each stage of compressor is 80 percent. The inlet temperature of each compressor stage should not exceed 56 °C (132.8 °F). The feed gas is saturated with water and 5 psi (34 kPa) pressure drop is allowed between each compressor discharge and exit of the flash separator.

Phase Envelope – The first step is to determine the state of the inlet to the 1st stage suction scrubber. The phase envelope for the feed gas after being saturated with water (stream 2) is shown in Figure 2. This figure also presents the phase envelope for stream 6 which is the vapor stream at the suction to the first stage of compression. The red circle displays the condition at the first stage suction.
Optimization Scenarios-Figure 3 presents the variation of compression ratios as a function of 1st stage discharge pressure. From this figure, it can be seen that equal compression ratios of 2.04 is obtained at a pressure of 65.2 bar. The ideal optimum interstage pressure for equal compression ratio is also found to be ![]() bar. Figure 4 presents the variation of each heat exchanger cooling load and each stage compression power requirement as a function of 1st stage discharge pressure. These variations are almost linear.
bar. Figure 4 presents the variation of each heat exchanger cooling load and each stage compression power requirement as a function of 1st stage discharge pressure. These variations are almost linear.


Table 2 presents the simulation results for two cases of optimizations. In case A , the total power requirements was minimized by finding the 1st stage discharge pressure with the constraint of equal stage compression ratio. This results in approximately equal compression power requirements for the two stages. It should be noted that the slight difference in compression ratio and stage compression power is due to the 34 kPa (5 psi) pressure-drop between discharge of 1st stage and suction of 2nd stage. However, in Case B, the total energy requirement was minimized by finding the 1st stage discharge pressure without the constraint of equal stage compression ratios. The results summarized in Table 2 indicate that there is a big difference between the case A and case B 1st stage discharge pressures. It can also be seen that the case A total power requirement (W1+W2) is clearly larger than case A (about 40 % higher).


The variation of total compression power and total cooling load requirement as a function of 1st stage discharge pressure are shown on the left hand side y-axis of Figure 5. This figure indicates clearly that the minimum power requirement occurs when the 1st stage discharge pressure is 77.8 bars. Figure 5 also provides an indication that the total power requirement changes very little for 1st Stage discharge pressures between about 76 bars and 80 bars.

Effect of Water Vapor in the Feed-The detail of simulation results based on unequal compression ratio for the two options of wet feed (saturated with water vapor) and dry feed is shown in Table 3. As can be seen from this table, water vapor has little effect on the performance of the process. The 0.23 % increased compression power requirement for the wet feed is due to 0.28 % increase in feed flow rate for the presence of water. It should be noted that the dry feed flow rate is 11953 kmol/hr and the wet feed flow rate is 11987 kmol/hr (34 kmol water/hr + 11953 kmol of dry gas/hr).

Effect of Heavy Ends in the Feed-In order to study the effect of heavy ends on the performance of the process, normal octane (nC8H18) was replaced with normal decane (nC10H22) and the simulation was repeated. The detail of simulation results based on unequal compression ratio for these two options of heavy ends is shown in Table 4. As can be seen from this table, the total compression power requirements decreases slightly for the case using nC10H22 due to the fact that more of the heavy component is removed in the first separator. The compressor power for the stages and heat exchanger duties are not affected by the presence of heavier components in the feed stream. In other words, the feed flow rate to the compressor decreases when nC8H18 is replaced by nC10H22.
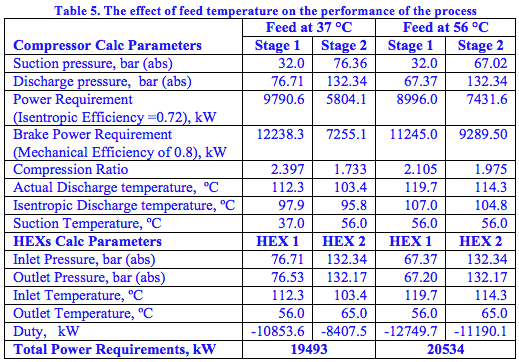
Effect of Feed Temperature – In order to study the effect of feed temperature on the performance of the process, the feed temperature was increased from 37 °C to 56 °C and the simulation results are shown in Table 5.

Table 5. The effect of feed temperature on the performance of the process
The feed at 56 °C represents the actual condition during the summer season. As can be seen from this table, the warmer feed requires an increase of 5.34 % in total compression power consumption. So the feed temperature is an important parameter and its variation, especially due to seasonal change, should be taken into considerations.
For the unequal compression ratio case having compression ratios of 2.397 and 1.733 for stages 1 and 2, respectively, the variation of energy requirement with feed temperature is shown in Figure 6. Stage 2 was not affected with the variation of feed temperature; therefore, the compression power and cooling load for stage 2 remained constant at 7.254 MW and 8.407 MW, respectively. Since, the compression ratio was constant, the compression power requirement for stage 1 varied from 12.2 to 13.28 MW; however, the cooling load varied drastically from 10.85 to 14.83 MW.

In the light of preceding discussion, the following tips are suggested:
- Be sure to check the phase of the compressor suction stream. This also includes the interstage condition to ensure that liquid does not enter the compressor.
- If economically possible, lower the interstage suction temperature since this will reduce the overall compression power requirement.
- Be sure to check the water content at the interstage conditions since there may be water drop out which would impact equipment performance.
- The choice of equal pressure ratios for minimizing the compression power requirement is close to an optimum choice when the suction temperatures are equal.
- Characterization of the heavy ends (C7+) does not greatly impact the compressor power requirement since heavy components are mostly removed in the inlet scrubber.
- Characterization of the C7+ will impact the condensation that takes place in the inlet suction scrubber and thus the molecular weight of the compressed gas will be affected.
Dr. Mahmood Moshfeghian

Thank you