The solubility of acid gases in TEG solution has been the subject of two previous Tips of the Month, (June 2012 and July 2012). In these instances, the focus was on gas streams with maximum acid gas partial pressure of 100 psia (690 kPa) and TEG concentrations of 95 and 100 wt%. This is typical for dehydration of sour gas streams.
This month, the focus shifts to the case where the gas is pure CO2, with partial pressures (and system pressures) ranging up to 800 psia (5 500 kPa), and pure TEG. These conditions approximate the dehydration of high-CO2 content gases in a CO2 enhanced oil recovery project, or perhaps, CO2 from an industrial source that is to be compressed, transported and sequestered.
Two algorithms have been developed to predict the CO2 solubility in pure TEG. One algorithm uses the same format as the Mamrosh-Fisher-Matthews [1] Solubility Model presented in the June 2012 and July 2012 Tips of the Month. In order to improve the correlation for pure CO2 and TEG, the equation parameters (A through D) were regressed using data extracted from Figure 20-76 of the GPSA Engineering Data Book [2]. The equation and new parameters are presented below.
In the second algorithm, we propose a 6-parameter empirical equation, which is also regressed from the GPSA Figure 20-76 [2].
Mamrosh-Fisher-Matthews Solubility Model MODIFIED:
The original Mamrosh et al. [1] model, was first applied to data extracted from GPSA Figure 20-76 [2]. Average Absolute Percentage Deviation (AAPD) was greater than 6.5% and the Maximum Absolute Percentage Difference for the data set exceeded 34%. To improve accuracy, a multi-parameter regression was performed using data from Figure 20-76. The new values for Parameters A, B, and D (C was set to zero and the original value of E was used) are presented in Table 1 below.
Where:
P is the absolute pressure, psia (kPa(a))
T is the absolute temperature, °R (K)
xi is the mole fraction of the acid gas in the liquid phase
yi is the mole fraction of acid gas in the vapor phase
Note that the mole fraction of water in the liquid ( is zero (pure TEG), so parameter “C” has been set to zero.
Table 1. MODIFIED Parameters for Mamrosh et al. model [1]
| System: Pure CO2 in100%TEG |
A |
B |
C |
D |
E |
|
(FPS) |
7.4188 |
-2727.79 |
0 |
0.11164 |
0.001864 |
|
(SI) |
9.3508 |
-1515.44 |
0 |
0.008996 |
0.003355 |
Accuracy of MODIFIED Mamrosh-Fisher-Matthews Solubility Model:
The accuracy of the MODIFIED Mamrosh et al. [1] model was evaluated against the data extracted from Figure 20-76 of Gas Processors Suppliers Association Engineering Data Book, 12th Edition [2]. The summary of our evaluation results is shown in Table 2.
Table 2. Summary of error analysis for MODIFIED Mamrosh et al. model
|
System |
N |
AAPD |
MAPD |
T Range, ˚F (˚C) |
P Range, psia (kPa) |
|
Pure CO2 in 100% TEG |
1018 |
1.85 |
10.08 |
77 – 165 (25 – 75) |
15 – 800 (100 – 5500) |
Where:
N = Number of data points
xi = mole fraction of acid gas in the liquid phase
Figure 1 presents the data extracted from GPSA Figure 20-76 [2] for the solubility of pure CO2 in 100% TEG, and the predicted values from the MODIFIED Mamrosh et al. equation. GPSA data points are denoted as symbols: Equation results are shown as solid lines.
Overall the accuracy is very good. At 15 psia, the error looks significant, and the absolute percentage deviation is as high as 10%. However; the actual solubility is small, so the magnitude of the error in physical terms is insignificant.
Proposed CO2 Solubility Model:
A 6-parameter empirical model was developed by regression of the data extracted from GPSA Figure 20-76 [2]. The general form of the equation is presented as Equation (2) and the values for the six parameters are provided in Table 3. The model is suitable only for pure CO2 and 100% TEG.
Figure 1 (FPS). Solubility of pure CO2 in 100% TEG – GPSA Fig. 20-76 versus MODIFIED Mamrosh et al. Model
NOTE: Data points from GPSA Fig. 20-76 [2] denoted by symbols: Equation is denoted by solid lines
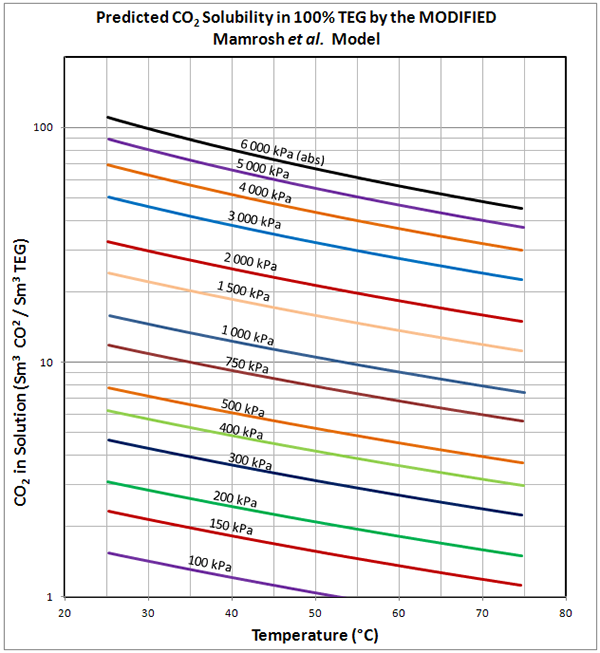
Figure 1 (SI). Predicted solubility of pure CO2 in 100% TEG – by MODIFIED Mamrosh et al. Model
Table 2. Parameters for Moshfeghian model for pure CO2 in 100% TEG
|
Units |
X1 |
X2 |
X3 |
X4 |
X5 |
X6 |
A |
|
(FPS) |
639.076 |
150.431 |
-2.6482 |
0.01178 |
0.003564 |
2.1731 |
1 |
|
(SI) |
355.042 |
1037.19 |
-2.6482 |
0.01178 |
0.003564 |
2.1731 |
7.4625 |
Accuracy of the Proposed Solubility Model:
The accuracy of the proposed model was evaluated against the data extracted from Figure 20-76 of Gas Processors Suppliers Association Engineering Data Book, 12th Edition [2]. The summary of our evaluation results is shown in Table 3.
Table 3. Summary of error analysis for Moshfeghian model.
|
System |
N |
AAPD |
MAPD |
T Range, ˚F (˚C) |
P Range, psia (kPa) |
|
Pure CO2 in 100% TEG |
1018 |
1.50 |
7.14 |
77 – 165 (25 – 75) |
15 – 800 (100 – 5500) |
Where AAPD and MAPD are as defined above.
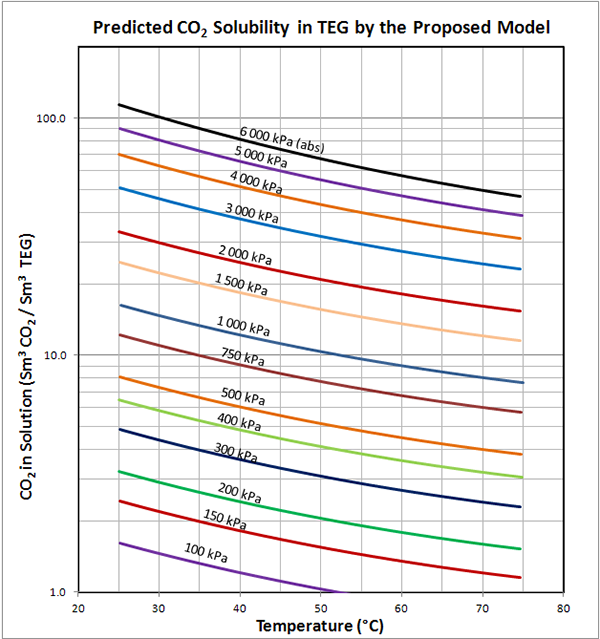
Figure 2 presents the data extracted from GPSA Figure 20-76 [2] for the solubility of pure CO2 in 100% TEG, and the predicted values from the proposed Model. GPSA data points are denoted as symbols: Equation results are shown as solid lines. Also included in Figure 2 are nine data points from GPA Technical Publication TP-9 [3]. These data points are actual values measured for pure CO2 and 100% TEG at three pressures. Note the TP-9 data were not used in the regression process.
The accuracy of the proposed Model is slightly better than the MODIFIED Mamrosh et al. model. Average and Maximum Absolute Percentage Deviations are both reduced. As with the MODIFIED Mamrosh et al. model, the greatest percentage error corresponds to the low pressure case (15 psia or 104 kPa) where the solubility is very small, so the actual deviation is likely insignificant for most engineering calculations.
Figure 3 presents the selected data from GPA RR 183 [4] for the solubility of pure CO2 in 100% TEG, and the predicted values from the Modified Mamrosh et al. Model and the Proposed Model. These GPA data were not used in regressing either of the two models parameters.
Figure 2 (FPS) Solubility of pure CO2 in 100% TEG – GPSA Fig. 20-76 versus the proposed model
NOTES: Data points extracted from GPSA Fig. 20-76 [2] denoted by symbols: Equation is denoted by solid lines
Large Black symbols and solid lines denote data from GPA TP9 [3]
Figure 2 (SI) Predicted solubility of pure CO2 in 100% TEG by the proposed Model
Figure 3. Comparison of the predicted solubility of pure CO2 in 100% TEG at 72.5 psia (500 kPaa) with the GPA RR 183 experimental data [4]
Conclusions:
Two new algorithms have been developed to predict the solubility of pure CO2 in 100% TEG. Both algorithms were developed by regressing data extracted from Figure 20-76 of the Gas Processors Suppliers Association Engineering Data Books [2]. It should be noted that the Figures in GPSA are attributed to Ed Wichert, Sogapro Engineering with all rights reserved.
The first algorithm is a Modified form of the Mamrosh et al. model [1]. The original model was presented and evaluated for CO2 concentrations of up to 10 mole percent in the June and July 2012 Tips of the Month. However, model predictions for pure CO2 and 100% TEG produced an average absolute percentage deviation (AAPD) of more than 6.5%, and a Maximum Absolute Percent Deviation (MAPD) of more than 34% compared with data extracted from Figure 20-76 of the GPSA Engineering Data book [2]. To improve accuracy, the equation parameters were regressed with data points extracted from Figure 20-76. The Modified Mamrosh et al. model more accurately reproduces the curves in Figure 20-76, with an AAPD of 1.85% and MAPD of 10.1%.
The second algorithm, the proposed Model, uses a different form of the equation. The six parameter model was also tuned to match data from GPSA Figure 20-76 [2]. The resulting AAPD is 1.50%, and the MAPD is 7.14% compared to Figure 20-76.
To learn more about similar cases and how to minimize operational problems, we suggest attending our G40 (Process/Facility Fundamentals), G4 (Gas Conditioning and Processing), P81 (CO2 Surface Facilities), and PF4 (Oil Production and Processing Facilities) courses.
John M. Campbell Consulting (JMCC) offers consulting expertise on this subject and many others. For more information about the services JMCC provides, visit our website at www.jmcampbellconsulting.com, or email us at consulting@jmcampbell.com.
By: Wes H. Wright & Dr. Mahmood Moshfeghian
Reference:
- Mamrosh, D., Fisher, K. and J. Matthews, “Preparing solubility data for use by the gas processing industry: Updating Key Resources,” Presented at 91st Gas Processors Association National Convention, New Orleans, Louisiana, USA, April 15-18, 2012.
- Gas Processors Suppliers Association; “ENGINEERING DATA BOOK” Twelfth Edition – FPS; Tulsa, Oklahoma, USA, 2004.
- Takahashi, S., Kobayashi, R., “The water content and the solubility of C02 in equilibrium with DEG-Water and TEG-Water solutions at feasible absorption conditions,” GPA Technical Publication TP-9, Gas Processors Association, Tulsa, Oklahoma, USA, 1982.
- Davis, P.M., et al., “The impact of sulfur species on glycol dehydration – Study of the solubility of certain gases and gas mixtures in glycol solutions at the elevated pressures and temperatures,” GPA Research Report 183 (GPA RR 183), Gas Processors Association, Tulsa, Oklahoma, USA, 2002.


It is very good technical description for engineering practice application.
How about accuracy vapor pressure prediction for TEG with small HC quantity (i.e. regenerated TEG on the TEG regenerator)? Hysys predict the vapor pressure almost equal to the operating pressure. Is it accurate enough compared to the actual condition?
Have you ever considered about including a little bit more than just your articles?
I mean, what you say is fundamental and all. But just imagine
if you added some great graphics or video clips to give your posts more, “pop”!
Your content is excellent but with pics and clips,
this site could certainly be one of the best in its niche.
Terrific blog!