An important physical property of a gas is the ratio of heat capacities. Heat capacity ratio is defined as the heat capacity at constant pressure divided by heat capacity at constant volume ![]() . It is used in the design and evaluation of many processes. For example, it is used in the design of components and determination of the overall performance of compressors. Engineers are frequently asked to evaluate a compressor performance utilizing traditional equations of head, power and discharge temperature. While these simplified equations may not give exact results, they give useful information needed to troubleshoot a machine, predict operating conditions, or a long-term trend analysis. The accuracy of any performance trending will depend on the proper selection of the ratio of heat capacities, which is necessary to correct performance figures for variations in fluid properties. Furthermore, specification of the method to which ‘k’ is determined must be established for the factory performance testing of new equipment to ensure supplier and purchaser are in agreement. This Tip of the Month (TOTM) presents graphical variation of ideal gas heat capacity ratio as a function of gas relative density (molecular weight) and temperature, and as a simple empirical correlation. The accuracy of this correlation is tested against pure compound data as well as gas mixtures using simulation software.
. It is used in the design and evaluation of many processes. For example, it is used in the design of components and determination of the overall performance of compressors. Engineers are frequently asked to evaluate a compressor performance utilizing traditional equations of head, power and discharge temperature. While these simplified equations may not give exact results, they give useful information needed to troubleshoot a machine, predict operating conditions, or a long-term trend analysis. The accuracy of any performance trending will depend on the proper selection of the ratio of heat capacities, which is necessary to correct performance figures for variations in fluid properties. Furthermore, specification of the method to which ‘k’ is determined must be established for the factory performance testing of new equipment to ensure supplier and purchaser are in agreement. This Tip of the Month (TOTM) presents graphical variation of ideal gas heat capacity ratio as a function of gas relative density (molecular weight) and temperature, and as a simple empirical correlation. The accuracy of this correlation is tested against pure compound data as well as gas mixtures using simulation software.
In the May 2009 Tip of The Month (TOTM), Honeywell [1] discussed six different methods of determination of heat capacity ratio![]() . He showed that variations of up to 6.4 % may results by choosing different pressure and temperatures.
. He showed that variations of up to 6.4 % may results by choosing different pressure and temperatures.
In the May 2009 Tip of The Month (TOTM), Honeywell [1] discussed six different methods of determination of heat capacity ratio (k=CP/CV). He showed that variations of up to 6.4 % may results by choosing different pressure and temperatures.
In the July 2009 (TOTM) [2], a single and relatively simple correlation was presented to estimate real gas heat capacity of natural gases as a function of pressure, temperature, and relative density (molecular weight). This correlation covers wide ranges of pressure (0.10 to 20 MPa, 14.5 to 2900 Psia), temperature (20 to 200 °C, 68 to 392 °F), and relative density (0.60 to 0.80).
Ideal Gas Heat Capacity Ratio:
For hydrocarbons, Passut and Danner [3] developed correlations for ideal gas properties such as enthalpy, heat capacity and entropy as a function of temperature. Passut and Danner [3] have reported the values of B, C, D, E and F for 89 pure compounds (mostly hydrocarbons) for their proposed correlation in the form of:
![]()

Figure 1. Ideal gas heat capacity of selected hydrocarbons based on Eq. 2

Figure 2. Ideal gas heat capacity of selected non-hydrocarbons based on Eq. 2
Two years later, Haung and Daubert [4] reported these parameters for 57 additional pure compounds, based on statistical mechanical formulae and with simplifications to facilitate engineering calculations. Aly and Lee [5] presented equations for calculating the ideal gas heat capacity, enthalpy, and entropy. Their equation for ![]() is:
is:
![]()
Aly and Lee reported the values of B through F for 60 pure compounds and later Fakeeha et al. [6] reported values of these constants for 32 additional hydrocarbons. Based on the Aly and Lee model, the variation of the ideal gas heat capacity at constant pressure of several hydrocarbons (methane through pentanes) and non-hydrocarbons (O2, N2, H2, CO2 and H2O) as a function of temperature are presented in Figures 1 and 2, respectively. Note the heat capacity for i-butane and n-butane as well as hydrogen and nitrogen are very close and their curves coincide.
For a pure compound, the heat capacity ratio (k) is defined as the ratio of molar heat capacity at constant pressure (Cp) to molar heat capacity at constant volume (Cy):
![]()
For an ideal gas,![]() ; therefore, Equation 3 can be written as:
; therefore, Equation 3 can be written as:
![]()
Where R is the universal gas constant and is equal to 8.314 kJ/kmol-°C (1.987 BTU/lbmol-°F). Also has the units of kJ/kmol-°C (BTU/lbmol-°F).
The GPSA Engineering Data Book [7] presents numerical values of ideal gas molar heat capacity, , as a function of temperature for pure compounds. Using Eq. 4 and the from the GPSA Engineering Data Book, the ideal gas heat capacity ratio, k, has been calculated and presented as a function of temperature in Figures 3 and 4 for selected pure hydrocarbons and non-hydrocarbon compounds, respectively.
Development of An Empirical Correlation for Ideal Gas k:
Previously used empirical derivations for k include Eq. 5 [8], which excludes for variation in temperature. If conditions on the equipment see little variation in operating point, this may be an acceptable way to trend performance short term, with inaccuracies in k resulting in performance prediction error.
![]()
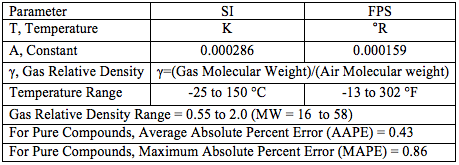
The objective of this TOTM was to obtain a simple correlation expressing ideal gas k as a function of gas relative density and temperature. Based on the 32 data points (8 isotherms and 4 points per isotherm) for pure hydrocarbons (methane, ethane, propane and butane) the following empirical equation for k as a function of gas relative density and temperature was developed.
![]()
Where:

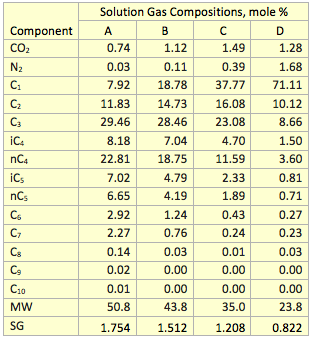
In order to evaluate the accuracy of the proposed correlation (Eq. 6), the ideal gas k for several gas mixtures were estimated by Eq. 6 and compared with the values calculated by SRK in ProMax [9] and from the numerical values for molar heat capacity at constant pressure presented in the GSPA Engineering Data Book [7]. Using the pure compound ideal gas molar heat capacity at constant pressure (Copi) and mole fraction (yi) for each component, the mixture ideal gas k was calculated by:

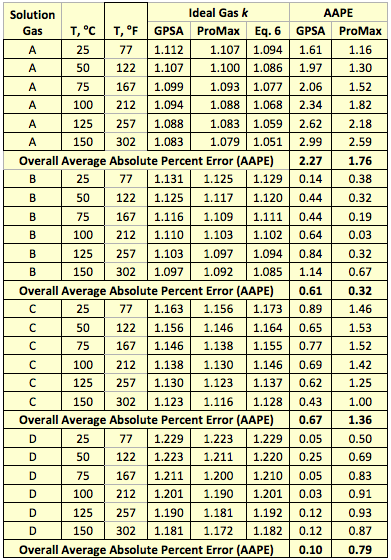
Using Eq. 7 and the ideal gas molar heat capacity at constant pressure ( ) reported in the GPSA Engineering Data Book [7], the ideal gas k was calculated at six different temperatures for four solution gas mixtures with compositions shown in Table 1. In addition, the ideal gas k was calculated by ProMax and the proposed correlation (Eq. 6). The comparisons of the results are shown in Table 2. This table indicates the accuracy of results is acceptable for facilities type calculations such as compressor discharge temperature, head and power calculations.

Figure 3. Ideal gas heat capacity ratio based on Eq. 4 for selected hydrocarbons

Figure 4. Ideal gas heat capacity ratio based on Eq. 4 for selected non-hydrocarbons
In order to visualize the accuracy and performance of a proposed correlation, generally, a graphical crossplot analysis is used. Figure 5 presents such a crossplot in which all predicted values are sketched against the experimental values. A 45˚ straight line (unit slope line) between the experimental values and predicted data points is drawn on the crossplot, which shows the perfect model line. The closer the plotted data to the 45˚ perfect model line, the higher is the consistency of the model.
Table 1. Solution gas composition used to test the proposed correlation

Conclusions:
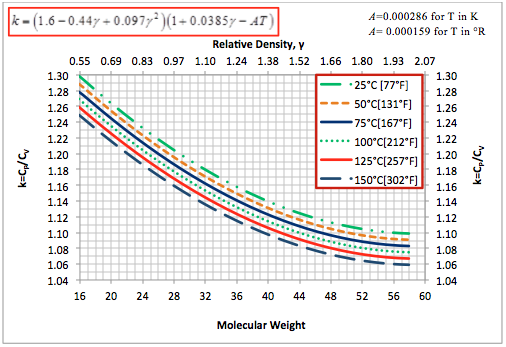
Based on the pure compounds ideal gas molar heat capacity at constant pressure, we developed a simple correlation (Eq. 6), which expresses the ideal gas k as a function of gas relative density and temperature. The accuracy of the proposed correlation was tested by estimating the ideal gas k for four solution gas mixtures at six different temperatures and compared them with those predicted by the GPSA Engineering Data Book method and the ProMax software. The comparison results are presented in Table 2. This table indicates that the accuracy of the proposed correlation is acceptable for facilities type calculations. Specifically, Eq. 6 can be used to estimate k for simplified compressor head, power and discharge temperature calculations. A graphical representation of Eq. 6 is also shown in Figure 6.
Table 2. Comparison of k predicted by Eq. 6, the GPSA, and ProMax methods

To learn more, we suggest attending our G40 (Process/Facility Fundamentals), G4 (Gas Conditioning and Processing), G5 (Gas Conditioning and Processing-Special), ME44 (Overview of Pumps and Compressors in Oil and Gas Facilities), ME46 (Compressor Systems – Mechanical Design and Specification), P81 (CO2 Surface Facilities), PF4 (Oil Production and Processing Facilities), and PL4 (Fundamentals of Onshore and Offshore Pipeline Systems) courses.
John M. Campbell Consulting (JMCC) offers consulting expertise on this subject and many others. For more information about the services JMCC provides, visit our website at www.jmcampbellconsulting.com, or email us at consulting@jmcampbell.com.
By: Dr. Mahmood Moshfeghian
References:
- Honeywell, J. “The Sensitivity of k-Values on Compressor Performance,” http://www.jmcampbell.com/tip-of-the-month/2009/05/the-sensitivity-of-k-values-on-compressor-performance/, May 2009.
- Moshfeghian, M., “Variation of Natural Gas Heat Capacity with Temperature, Pressure, and Relative Density,” http://www.jmcampbell.com/tip-of-the-month/2009/07/variation-of-natural-gas-heat-capacity-with-temperature-pressure-and-relative-density/ , July 2009.
- Passut, C.A., Danner. R.P., lnd. Eng. Chem., Process Des. Develop., 11,543, 1972.
- Haung, P.K. and Daubert, T.E., Ind. Eng. Chem., Process Des. Develop., Vol. 13, No. 2, 1974.
- Aly, F.A. and Lee, L.L., Fluid Phase Equilibria, 6 169-179, 1981.
- Fakeeha, A., Kache, A., Rehman, Z., Shoup, Y. and Lee, L.L., Fluid Phase Equilibria, 11, 225-232, 1983
- GPSA Engineering Data Book, Volume 1, 13th Ed., Gas Processors Suppliers Associations, Tulsa, Oklahoma, 2012.
- Campbell, J.M., “Gas Conditioning and processing, Vol. 2: The equipment Module,” 8th Edition, John M Campbell & Company, Norman, Oklahoma, 2001.
- ProMax 3.2, Bryan Research and Engineering, Inc., Bryan, Texas, 2012.

Figure 5. Accuracy of the proposed correlation (Eq. 6) against the k calculated by Eq. 7

Figure 6. Ideal gas heat capacity ratio based on Eq. 6 for pure hydrocabons and gas mixtures

wealth of information. many thanks for sharing and educating us all. greatly appreciated
Thanks. I am glad you find this TOTM useful.
I would like to apply for Oil&Gas Course.
Definitely.
At first glance that looked impossible to understand but if you read it carefully it is a lot more understandable!
The first part up to: “Development of An Empirical Correlation for Ideal Gas k:” is introduction and background and the main message/tip is the proposed correlation and diagram.
I am extremely impressed together with your writing ability plus with all the layout on the blog site. Is that this the paid theme or did you adjust it on your own? Either way carry on the great good quality composing, it can be exceptional to determine a good weblog such as this one right now..
Excellent content and very well explained. I appreciate you sharing this wealth of knowledge, and it was just what I was looking for.