In this Tip of the Month (TOTM) we will discuss how to determine CO2 solubility and flashing issues in water at pressures and temperatures commonly associated with gathering systems and production facilities. This is mainly important for CO2 Enhanced Oil Recovery (EOR) floods as the CO2 concentration is high and the initial separation is at higher pressures than is common in non-CO2 EOR oilfields. These two conditions result in significant dissolving of CO2 into the produced water with resultant flash gas from downstream Free Water Knockouts (FWKO), treaters, and tanks. In mature CO2 EOR floods with Water-Alternating-Gas (WAG) injection schemes, it is likely that most of the flash gas in the downstream separations will be from the produced water.
While this TOTM is significant mainly for CO2 EOR floods, the following analysis is general in nature; it would apply to other situations involving CO2 solubility in water issues. This analysis assumes that there is no H2S. H2S would have somewhat higher solubility than CO2 which would force more gas to flash from the FWKO and tanks. Higher H2S than about 5% would begin to appreciably increase the solubility of H2S into water.
A hypothetical field production example will demonstrate how to calculate the CO2 solubility and flash gas volumes. The field configuration is shown in Figure 1.
A common configuration for a CO2 EOR flood is to have the field gathering system consist of three flashes. The first flash is at the Field Separators, the second flash is at the FWKO, and the third flash is at the tanks. A number of wells are gathered into Field Separators for the first flash of gas from the liquids. For the purposes of this case, all separators are assumed to operate at a single pressure and temperature. The amount of gas from the Field Separators is not able to be calculated from the analysis presented in this TOTM. Instead, the gas from this separation is the result of the complex flows within the reservoir through the downhole equipment to the separator. This analysis is applicable to the next two flashes that result from the liquid flowing to the FWKO and then to the Water Tank. Also note that the gas from the oil (which includes both hydrocarbon gas and CO2 and also will be a significant volume) is beyond the scope of this analysis.

Figure 1. A simplified production flow diagram
With the above figure and discussion in mind, the problem statement is as follows:
A CO2 EOR flood is in operation. The Field Separators operate 15.6 °C (60 °F) and 1483 kPag (215 psig) and the gathering system gas is 87.5% CO2. The liquids flow from the Field Separators to a central tank battery where the unheated FWKO is operating 15.6 °C ( 60 °F) and 207 kPag (30 psig) and the gas from it is 89.7% CO2. The tanks operate at 3.45 kPag (0.5 psig.) The atmospheric pressure is 93.1 kPaa (13.5 psia). The water from the field is 3180 STm3/d (20,000 bbl/day) and has 4 wt% associated salts.
Determine the amount of gas flashed from the produced water at the FWKO and water tanks.
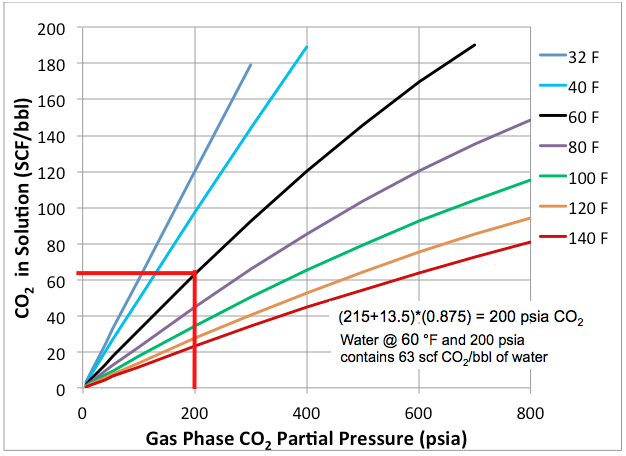
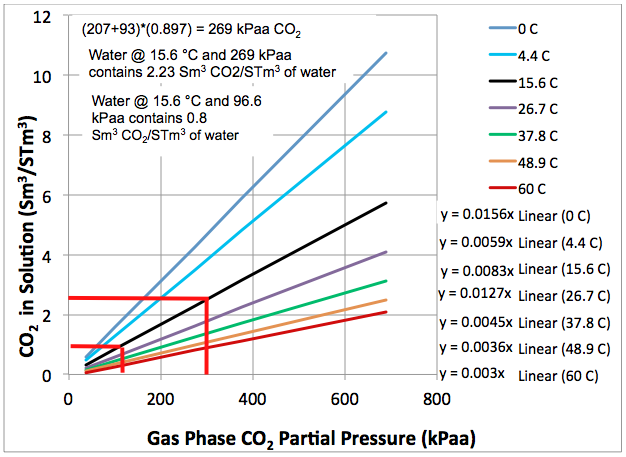
The analysis begins by determining the CO2 in solution within the Field Separators. The solution gas is determined from Figure 2 below.

Figure 2 (SI). Solubility of CO2 in fresh water as a function of its partial pressure

Figure 2 (FPS). Solubility of CO2 in fresh water as a function of its partial pressure
Step 1 – Find the amount of CO2 in solution in the water in the Field Separator from Figure 1. Determine the CO2 partial pressure in the gas phase of the Field Separator which is operating at 1380 kPaa (200 psia). Then read the gas saturation at the separation temperature which is 15.6 °C (60 °F). The solution gas is determined to be 11.23 Sm3/STm3 (63 scf/bbl). The key is to measure the gas composition at the outlet of the Field Separator.
Note that the curves for 0 °C (32 °F) stops at 2069 kPaa (300 psia), 4.4 °C (40 °F) stops at 2759 kPaa (400 psia), and 15.6 °C (60 °F) stops at 4828 kPaa (700 psia) CO2 partial pressure. That is because the CO2 becomes liquid as it increases much past these pressures. No design should contemplate separation where the CO2 is still liquid. Its density would be too close to oil so separation would not be feasible. The curves themselves will not extrapolate successfully from these endpoints; the character of the curve changes as the CO2 moves into the liquid phase.
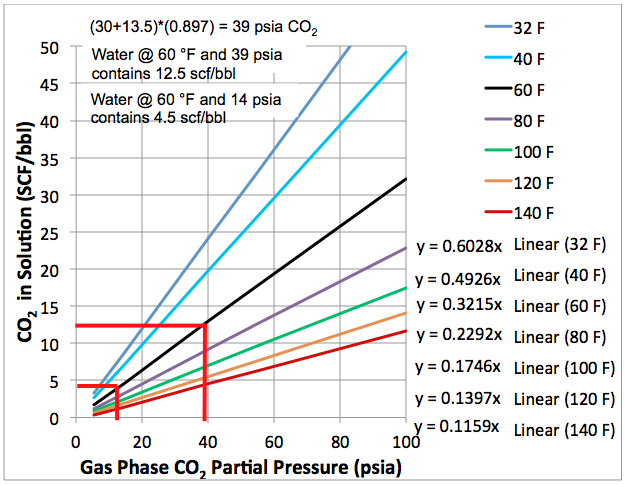
It is not easy to read the saturation at the FWKO and even more difficult to read the tanks so a close-up of the graph has been prepared as Figure 3. The “X” axis is now zero to 690 kPaa (100 psia) rather than zero to 5517 kPaa (800 psig). The “Y” axis is now zero to 8.92 Sm3/STm3 (50 scf/bbl) rather than zero to 35.66 Sm3/STm3 (200 scf/bbl). The various curves now are reasonably approximated as straight lines which intercept the “Y” axis at zero. The equations are included.

Figure 3 (SI). Close-up of solubility of CO2 in fresh water as a function of its partial pressure

Figure 3 (FPS). Close-up of solubility of CO2 in fresh water as a function of pressure
Step 2 – The CO2 solubility of the water in the FWKO is determined in the same fashion as for the Field Separator. The composition of the gas is the gas exiting the FWKO is the composition to use to determine the CO2 partial pressure. In the FWKO 2.23 Sm3/STm3 (12.5 scf/bbl) remains in solution.
Step 3 – This shows the gas in solution in the storage tanks. An assumption is made that the gas is liberated from the tankage that the tanks are 100% CO2. It will be slightly less than 100% but should be close enough for design purposes. This assumption will slightly overstate the amount of CO2 remaining in solution. Observe that in the storage tanks the water still has 0.8 Sm3/STm3 (4.5 scf/bbl) of CO2. This is enough CO2 to make the water substantially more corrosive than water from non-CO2 EOR floods.
The determination of CO2 solubility has thus far been made for fresh water but the produced water contains salts (Na, Mg, Ca). An adjustment is to be made for each of the three saturations based on the 15.6 °C (60 °F) temperature and the salts percentage by weight of the produced water. This is accomplished with Figure 4 which calculates the appropriate reduction in solubility.

Figure 4. Brine Correction for CO2 Solubility in Water
Step 4 – Make the adjustments for salt in the water by applying the Salinity Reduction Factor (SRF). The temperature impact is small enough that only three curves are shown. It would be too difficult to read the graph if all curves were shown. To read this point it may be easier to use the corresponding Table 1 which contains more temperature data.
Table 1. Salt Reduction Factor (SRF) [1]

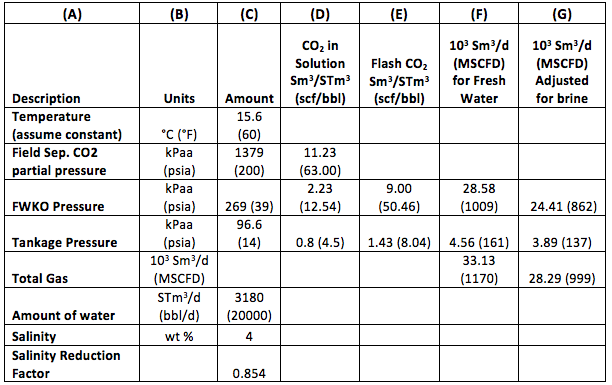
The data obtained from the graphs and data from the problem statement are summarized in Table 2. With some calculations the appropriate gas volumes can be determined.
Table 2. Example of CO2 Flashing for 3180 STm3/d (20,000 bbl/day) of Water, 4% Salts

Step 5 – Column (D) – Input the data from Figure 2 and Figure 3 into the appropriate row
Step 6 – Column (C) – Input the SRF from Figure 4 into the last row
Step 7 – Column (E) – Subtract 2.23 Sm3/STm3 (12.54 scf/bbl) from 11.23 Sm3/STm3 (63 scf/bbl) = 9 Sm3/STm3 (50.46 scf/bbl) to calculate the amount of gas that evolves from solution into the gas phase from the Field Separators to the FWKO.
Step 8 – Column (E) – Subtract 0.8 Sm3/STm3 (4.5 scf/bbl) from 2.23 Sm3/STm3 (12.54 scf/bbl) = 1.43 Sm3/STm3 (8.04 scf/bbl) to calculate the amount of gas that evolves from solution into the gas phase from the FWKO to the tankage.
Step 9 – Column (F) – Multiply 9.00 Sm3/STm3 (50.46 scf/bbl) times 3180 STm3/d (20,000 bbl/d) = 28.58×10³ Sm3/d (1009 MSCFD) to calculate the amount of gas to compress from the FWKO
Step 10 – Column (F) – Multiply 1.43 Sm3/STm3 (8.04 scf/bbl) times 3180 3180 STm3/d (20,000 bbl/d) = 4.56×10³ Sm3/d (161 MSCFD) to calculate the amount of gas to compress from the tankage
Step 11 – Column (G) – Multiply the quantities of Column (F) times the SRF to determine the gas as adjusted for salinity. The total gas is 28.29×10³ Sm3/d (999 MSCFD).
Supplemental Data:
A 2nd order polynomial for each of the curves in Figure/s 2 has been prepared. These equations will allow the user to determine the solution gas by calculation rather than by reading the graphs directly.
Figure 2 can be presented by Equation 1 [2].
SCO2 = A (PCO2)2 + B (PCO2) (1)
Where:

Conclusions:
The combination of relatively high Field Separator pressures and high CO2 content in gas from CO2 EOR floods results in substantial flashing of CO2 from water in the FWKO and tanks. This has the potential of overwhelming the piping, Vapor Recovery Units, and Flash Gas compressors.
To learn more about similar cases and how to determine the impact of CO2 on field operational problems, we suggest attending our PF81 (CO2 Surface Facilities) course.
John M. Campbell Consulting (JMCC) offers consulting expertise on this subject and many others. For more information about the services JMCC provides, visit our website at http://petroskills.com/consulting, or email us at consulting@PetroSkills.com.
By: Paul Carmody
Reference:
- Chang, Y.-B., Coats, B. K., & Nolen, J. S. (1998, April 1). A Compositional Model for CO2 Floods Including CO2 Solubility in Water. Society of Petroleum Engineers. doi:10.2118/35164-PA.
- VMG Sim v8.0 (Build 85) August 2014, Thermo = “APR for Natural Gas”.

I’d like to receive your “Tip of the month”.
Excellent article.
Comme un débutant, je suis constamment à la recherche en ligne pour les articles qui peuvent m’être utile. Merci
Todas y cada una de las opciones para poder ver peliculas para
descargar son de forma gratuita, sin precisar crear cuentas, bajar programas abonar algo.