In a previous “Tip of the Month” we explained how a phase envelope is generated and what factors affect the shape and accuracy of a phase envelope.
In this tip, we will show several methods of C7+ (heavy ends) characterization and check the accuracy of each method and present tips to improve the accuracy of each method. For more detail, please refer to Gas Conditioning and Processing, Volume 3, Advanced Techniques and Applications.
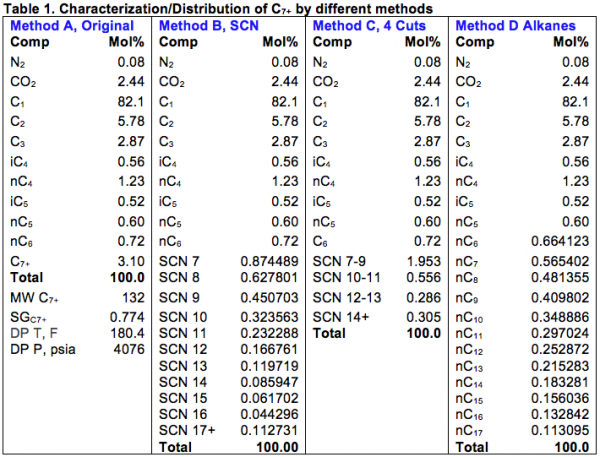
Let’s consider a rich gas with the composition shown in the first two column of Table 1. This rich gas contains 3.1 mol% C7+ with reported MW=132 and SG=0.774. The experimentally measured dew point pressure is 4075.6 psia at 180.4 °F. For this case study, we will use PR EoS, needless to say that similar results are obtained by SRK EoS.

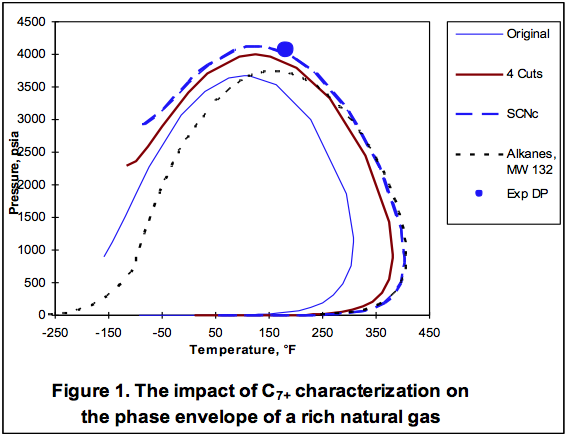
Method A: In this method we will treat C7+ as a single cut and based on its MW and SG, we will predict its normal boiling point (NBP=317.2 °F), critical temperature (Tc=645.2 °F), critical pressure (Pc=371.6 psia), and acentric factor (ω=0.425574) using correlations similar to the ones by Riazi and Duabert [1] which are on page 107, Chapter 4, Gas Conditioning and Processing, Volume 1, Basic Principles. The predicted dew point pressure is 3433 psia far away from the measured value of 4076 psia. The predicted phase envelope for this method is shown in Figure 1. As can be seen, this phase envelope does not pass through the measured dew point.

Method B: We break the C7+ into 11 Single Carbon Numbers (SCN) ranging from SCN 7 to SCN 17+ using the exponential decay procedure presented by Katz [2] and applied by others [3-5]. The resulting distributions are shown in the 3rd and 4th column of Table 1. The predicted dew point pressure is 4030 psia which is relatively accurate. The corresponding phase envelope is shown in Figure 1 which almost passes through the measured dew point.
Method C: We lumped the 11 SCN components of Method B into 4 cuts. These cuts and compositions are shown in the 5th and 6th column of Table 1. The predicted dew point pressure is 3885 psia and the corresponding phase envelope is plotted in Figure 1.
Method D: This method is similar to Method B, except that we used 12 normal parafins (alkanes) instead of SCN components to represent the C6+. The 7th and 8th column of Table 1 present the distribution of nC6 to nC17. The predicted dew point pressure is 3730 psia and the corresponding phase envelope is also shown on Figure 1. The advantage of this method is that n-alkane components are readily available in many commercial software where as the SCNs may not.
Figure 1 indicates that none of the methods, except method B which come close, matches the experimentally measured dew point. In the next section, we show how the prediction of each method can be improved to match the experimentally measured dew point.
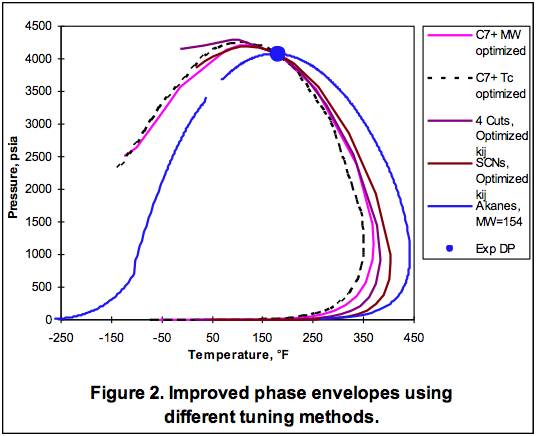
Adjusting MW (or Tc) in Method A: As can be seen in Figure 2, by changing MW of C7+ to 152.5, we can match the measured dew point, perfectly. Please note that based on MW=152.5 and SG=0.774, the new values for the estimated properties will be NBP= 381 °F, Pc=308.4 psia, Tc=706.9 °F, and ω= 0.468456. An alternative option is to adjust only Tc to 703.5 °F. Again, the tuned Tc makes the phase envelope pass through the measured dew point as shown in Figure 2. The Tc adjustment is preferred because less work is involved.

Tuning binary interaction parameters, kij, in Methods B and C: A common correlation to estimate the binary interaction parameter is:

In the above equation, Vci and Vcj represent the critical volumes of components i and j, respectively. The default value of exponent n is normally set to 1.2 but it can be used as a tuning parameter to match the experimentally measured dew point. For our case study, we obtained n=1.3011 for Method B and n=1.6573 for Method C. The resulting phase envelopes for these two methods are shown in Figure 2.
Tuning MW in Method D: The distribution (i.e. mole %) of the alkane part of C6+ depends on the assumed value of C6+ MW. As shown in Figure 2, by changing MW of C6+ to 154, we can match the measured dew point, perfectly.
As can be seen from Figure 2, all of the generated (tuned) phase envelopes are passing through the measured dew point; but they have different cricondentherm point. Are all of these phase envelopes correct? In the next tip of the month we will demonstrate how to choose the most accurate phase envelope!
By: Dr. Mahmood Moshfeghian

What are the SCNc and how they are determined?