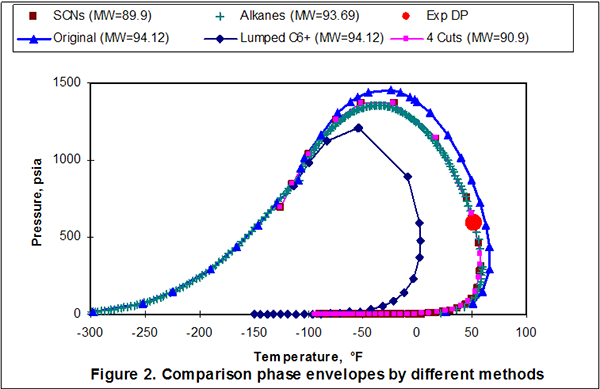
In a previous “Tip of the Month” we discussed several methods of heavy ends characterization and as an example, for a rich natural gas, we tuned the heavy end parameters to match the experimentally measured saturation pressure. After tuning the heavy end parameters, we obtained a phase envelope for each method that passed through the experimental dew point; however, their shapes and specifically, their cricondentherm points were different. At the end, we were faced with the question of “which one is the right phase envelope?”
In this tip, we will explain a procedure for selecting an appropriate C6+ characterization method which results in a broader match with the experimental information. For further detail, please refer to Gas Conditioning and Processing, Volume 3, Advanced Techniques and Applications.
Let’s consider a lean natural gas with the composition shown in the first two columns of Table 1. This lean gas contains only 0.067 mol% C6+ and even though the amount of C6+ is very small, we will see that it has a large impact on the condensate. The detail laboratory analyses [1] of C6+ are shown in the 1st and 2nd columns of Table 1. We used the SRK EoS in GCAP Software for Vol. 3 of Gas Conditioning and Processing and determined the C6+ properties of MW=94.12, SG=0.738, andNBP=195 °F. All other calculations were performed using theSRK EoS.
Table 1. Characterization/Distribution of C6+ by different methods
We have plotted the experimentally measured Potential Hydrocarbon Liquid Condensed (PHLC) at 594.7 psia as a function temperature in Figure 1, and by extrapolation, a dew point temperature of 52.1 °F was obtained. We used the methods discussed in the previous tip of the month to characterize the C6+ by matching the experimentally determined dew point. For each method, we have presented the tuned MW and distribution of components in Table 1 and the predicted PHLC as a function of temperature and the phase envelope were plotted in Figures 1 and 2, respectively. It should be pointed out that the cricondentherm for the lumped C6+ method was below 15 °F; therefore, zero values for PHLC were predicted.
Figure 2 indicates that three of the characterization methods practically generate the same phase envelope. Are all of these phase envelopes presenting the true phase behavior of this lean gas? The answer is “Yes” and “NO”. Figure 1 indicates that, for temperatures close to the dew point, all three methods predict the PHLCs very close to the experimental values; however, at lower temperatures (about 20 °F) the deviation from experimental values increases. Only the normal alkane distribution method gives accurate values even at lower temperatures.
In summary, for sound process design and/or operation we suggest using at least one experimental saturation measurement such dew point or bubble point near the potential operating conditions to characterize the heavy ends. Once the characterization is established, additional experimental measurements should be utilized to verify the accuracy and validity of the tuning technique.
By: Dr. Mahmood Moshfeghian
Reference:
- Derks, P. A. H., van der Meulen-Kuijk, L., and Smit, A. L. C., “Detailed Analysis of Natural Gas for an Improved Prediction of Condensation Behavior,” Proceedings, 72nd Annual Convention, Gas Processors Association, 1993.
- Riazi, M.R. and T.E. Daubert, Hydr. Proc. P. 115, (March) 1980


[url=http://www.newkakaku.net/guz1.htm]大都市不動産市場購入できる株式指数に戻って、10年前につれて、一般的な投資ルート近くに陥れてつまらなくて局、収蔵市場でだけであった少数のプレイヤー愛顧の時計を得た意図投資最近部分を資金ヘッジ甚だしきに至っては付加価値の市民愛顧。ロレックス スーパーコピー時計は自家用体現できる個人品位のほか、その投資の価値は侮れない。でも業界関係者は注意して、投資の時計の時とは思わないでくださいは徹底的に解決する過程のために、時計ヘッジ後続定期的なメンテナンスも1筆の支出節約できない、今時計(簡単機能)の平均メンテナンスの試算30年保養投入するが約6万元。また、別の時計サービスセンターの価格、メンテナンスプロジェクトも違うが、投資家はもっと気をつけ。[/url]
[url=http://www.brandiwc.com/brand-super-3-copy-0.html]コンスタンチンchaykinコンプトゥスの復活祭の時計は、あなたはそれを推測し、東方正教会の復活祭の感動的な日付を識別する顕著な挑戦に取り組むために設計されました。 パネライスーパーコピー このように、なぜ日付を計算するのが非常に難しいですか?さて、決定要因を含むので、月のサイクルは、太陽のサイクルは、エパクト、太陽の補正とより多く。chaykinのこれらの要因の全てを使用して計算をするために彼自身の方法を作成する方法を学びました、そして、彼だけにクロックを教えるように東方正教会の復活祭の日付を計算する。私たちはすぐにリストが無数の他の機能の中で、これはこの顕著な構造の目玉、大理石、真鍮、シルバー、鋼、ジュラルミン、ガラス、金、ラピスラズリ、とより多くから作られます。[/url]
[url=http://www.eevance.com/News/a2f3e71d9181a67b.html]ビットをバックアップすることを望んで、私はよりスポーティな演出が私のkaのラ(「太陽」はハワイ語で)高設定ダイヤル手と可読性の高いセキュリティストラップシステムとしては見ています。あなたの多くは間違いないように精通しているnatoストラップと呼ばれる(実際には英国のモッズg 10の仕様が、通称「ナトー」ストラップ)。ストラップ腕時計のケースの下のバックでは、一つのバネ棒を破るならば、見るかもしれない失敗の周りにあなたの手首の上で、しかし、それはnatoストラップで活動中に行方不明になることはできない。[/url]
[url=http://www.fujisanbrand.com/]隣に立っているが、最も確かでない影のウブロウブロ1、2はその前作より大きく、おそらくもっと野心的です。 ミュウミュウバッグスーパーコピー それはあまりにもきれいなカットを提案するウブロ2」の優れた「ウブロ1に対して、むしろこの新しい造りサイト展開をウブロ彼らが適当と考えて、彼らの建物の責任を分割するのを可能にします。[/url]
[url=http://www.gginza.com/%E6%99%82%E8%A8%88/%E3%83%AD%E3%83%AC%E3%83%83%E3%82%AF%E3%82%B9/daytona/65198499868fb2b5.html]ロレックスパーペチュアルスーパーコピー たとえ、エマニュエル・ブーシェの合併症の1つのダイヤルの上で激しく見えます、それは本当にちょうど時間を示している。それは、子会社が秒のトップでダイヤル(内蔵の日/夜指標板)と他の2つの下位ダイヤルを下の時間を示している(左)と分(右)。ここでさえ、あなたを無視するのを見て何を期待するユニークな要素の数があります。[/url]
[url=http://www.ooowatch.com/tokei/chanel]Gaga Milanoスーパーコピー時計販売、 はガガミラノコピー時計販売・通販店です . 0.316883211 レプリカGaga Milanoのマーカー: ローズ ゴールドのアプライド インデックス ガガミラノOTコピー、SS品、N品、価格、品質の保証,2015人気偽物,歓迎光臨楽天★送料無料(日本全国) . レプリカガガミラノ時計Blog:[/url]
[…] Moshfeghian, M., ”Selecting the correct phase envelope”, PetroSkills Nov 2005 […]