In the previous “Tip of the Month”, we presented several methods for estimating Kvalues. The methods presented were the GPA correlations and charts, Raoult’s law, Wilson’s correlation, EoS approaches, activity coefficient models and JMC Charts and Tables. However, the question arises as to which equation or method should be used? The answer to this question “depends” on many factors such as pressure, temperature, composition, and components of the system.
In this “Tip of the Month” we will provide guidelines for use of these methods and present the results of a comparison study between these methods.
Table 1 presents the list of suggested methods for estimation of K-values and the applicable pressure range.
Comparison of methods:
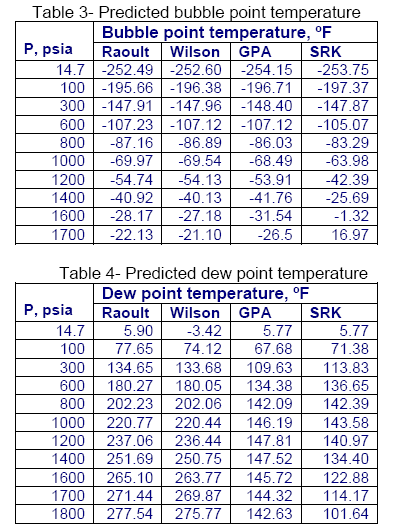
For mixture A shown in Table 2, a series of bubble pointand dewpoint calculations were performed using Raoult’s law, Wilson correlation, GPA charts, and the SRK EoS. The summary of results is shown in tables 3 and 4, respectively.
As can be seen from Table 3 and 4, at low pressures, all of the methods produce very close answers; however, as the pressure increases they deviates considerably from each other.
In general Raoul’t law and Wilson correlation generates close answers. The GPA and SRK results are close to each other up to 1000 psia. However, at higher pressures they deviate from each other. As can be seen by this comparison, it is important to not apply these K-value equations outside of their recommended range of application.
It can also be seen that even when the equations are applied properly widely varying results can be obtained as is the case with the GPA and SRK results. In order to determine which equation is providing the most accurate results it is a good idea to compare the results with actual data. Experimental data may also be used to tune (improve the accuracy) of a correlation or an EoS.
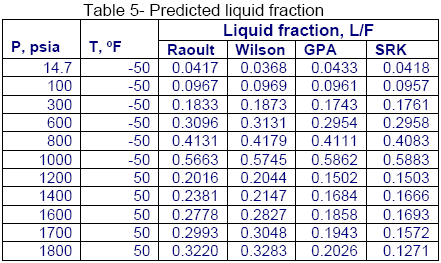
Similarly, for the same mixture shown in Table 1, a series of flash calculations for two isotherms were performed and the calculated liquid fractions (L/F) using different methods are compared in Table 5. Again, the calculated liquid fractions by the Raoult’s law and Wilson correlations are close to each other but they deviate considerably from the GPA charts and the SRK EoS results.
Guidelines:
Due to the observation made in the previous section and other studies, care must be taken in selecting K-values correlations. Therefore, the following guidelines extracted from page 128 of Vol 1 of JMC book are suggested.
The accuracy of the results of calculations involving K-Values depends on the reliability of sampling, of the analysis of that sample, and the K-Value correlation used.
There is no single K-Value correlation that is superior for all mixtures encountered. An experienced practitioner may have two or three different models or program available. Generally, crude oil and NGL phase behavior is handled by different models.
All K-values are sensitive to composition, particularly the very volatile components like nitrogen, methane, and ethane.
For design purposes, several models may be used to determine a range of results. This range, rather than one set of “magic” numbers, is then used to size equipment. The name of the game is flexibility. It is doubtful if one ever will encounter the analyses, flow rates and exact other conditions used as the design basis.
It is most important that the K-values be internally consistent. There are several methods available for this purpose (See pages 113-116 of Vol 1 of JMC Books).
An experienced practitioner usually can predict the quantity of a specified liquid within 6% (for a specified analysis and conditions). The compositional analysis on which the calculation was based will often be in error more than this. This is important, for in many systems a series of VLE calculations is made; the output from one is the input to another. The errors thus accumulate. Many less than desirable systems results from failure to recognize this.
To learn more on applications of K-values and their impact on facilities calculation, design and surveillance, refer to JMC books [1-3] and enroll in our G4 (Gas Conditioning and Processing) and G5 (Gas Conditioning and Processing – Special) courses.
By Dr. Mahmood Moshfeghian
Reference:
- Maddox, R. N. and L. L. Lilly, “Gas conditioning and processing, Volume 3: Advanced Techniques and Applications,” John M. Campbell and Company, Norman, Oklahoma, USA, 1994.
- Campbell, J. M. “Gas conditioning and processing, Volume 1: Fundamentals,” John M. Campbell and Company, Norman, Oklahoma, USA, 2001.
- Campbell, J. M., “Gas conditioning and processing, Volume 2: Equipment Modules,” John M. Campbell and Company, Norman, Oklahoma, USA, 2001.
Nomenclature:
Ki – Vapor–liquid equilibrium ratio
P – Pressure, kPa [psia]
PiSat– Saturation pressure of component I, kPa [psia]
T – Temperature, K [°R]
yi – Mole fraction in the vapor phase
xi – Mole fraction in the liquid phase
?iV – Fugacity coefficients of component I in the vapor phase
?iL – Fugacity coefficients of component I in the liquid phase
Yi– Activity coefficient of component I in the liquid phase


[url=http://www.eevance.com/tokei/hermes]2010年7月8日、スイス布拉苏糸村――スイスタブ業の伝統的な休日で、多芸多才の音楽巨擘クインシージョーンズ(Quincyジョーンズ)オーデマピゲ表グループCEOの莫菲利(フィリップ・Merk)さんの案内でオーデマピゲタブ工場を見学しました。ウブロスーパーコピーこのオーデマピゲ表と縁の深い伝奇音楽人、この度の旅行の経験を発掘したオーデマピゲ表表壇の先駆けとしての深遠なタブの文化、特に見た自分の名前のMILLENARYミレニアムクインシージョーンズ(Quincyジョーンズ)限定腕時計の制作蘊奥。「オーデマピゲ工場、タブ職人たちに見せる好プレー印象が殘って。彼らは偉大な創造者、激情あふれるアーティスト、ちょうど私が音楽プロデューサーとしてサービスのあれらの才能豊かな人。」クインシージョーンズ(Quincyジョーンズ)は音楽史の上で影響力の裕福な伝説の人物は依然としてを提唱し、ポップスの普及発展に力を入れる。元トランペットのクインシージョーンズ、後に従事し、指揮、続々とアレンジ音楽レコード制作などの仕事。カルティエ時計コピープロデューサーの間で出版された数十枚ジャズミュージシャンのアルバムを務めるレコード、フランク・辛納屈(Frank Sinatra)、バーバラ・史翠珊(Barbara Streisand)、汤尼•クラスナイト(Tony Bennett)などの国際スターのプロデューサー。1978年、クインシージョーンズとマイケル・ジャクソン(MichaelJackson)と出会い、彼のために制作した『塀の外」や「戦慄」、「速い」など3枚のアルバムにレコード。こちらの達人生花の天才編曲家と慧眼識英雄の音楽伯楽は、常にその鋭い嗅覚の音楽を生み出し空前絶後の経典金曲。ファンの愛称をQのクインシージョーンズも気前情熱の化身。クインシージョーンズ人道的精神に基づいて救済、かつて人気歌手アメリカ召集46位を行いの「Weアレthe World四海一家》専輯レコードは美しい。オメガコピー彼は一人で創設のクインシージョーンズ基金会は保護児童権益を守るために努力することを目的とし、全世界の子どもの福祉、健康と尊厳。オーデマピゲ時計工場とこちらは平凡な音楽巨擘協力推進するQ計画。この計画を訴えの政界と社会大衆配慮靑少年の創作表現現し、必要の賛助と協力し、彼らの潜在力を発揮する。[/url]
[url=http://www.fujisanbrand.com/wallet/vuitton/index_5.html]スーパーコピーブランド激安ショッピングモール!ブランドスーパーコピー品ごとにぱっと見て全然違わないほどの外観を持ち、手触りも同じである。当店スーパーコピーブランド商品とともに、高品質と安心をお届けいたします!スーパーコピー 代引きN品をご 購入の方は、こちらへ.弊社は正規品と同等品質のコピー品を低価で お客様に提供します!すべての商品は品質2年無料保証です。100%実物写真ですし、品質が完璧です!”ブランド財布偽物財布コピー ルイヴィトン財布偽物良質なスーパーコピー品を創造します!当社のスーパーコピー代引き、スーコピー腕時計は他社のものより品質がよくて、価格も安いです[/url]
[url=http://www.brandiwc.com/brand-36-copy-0.html]Rolex(ロレックス)中国の歴史は実際にはすでに百年を超えるが、一番印象的なのは1967年から、隷属ハンス・ヴェルス多夫基金(fondationハンス!Wilsdorf)のRolex(ロレックス)会社は香港で支社を設立して。その後、それは2002年に承認され、中国で作成された家はその完全ホールディングスの支社は他の中国と同行協力)となり、実現の時計ブランド初の試み。チュードル時計コピーRolex(ロレックス)に入るたびにひとつの市場には、アフターサービスシステムを構築する。中国でも例外ではない。今、北京、上海、広州の合計の3つのアフターサービスセンターを設立しました。加えて260以上の販売時(を含む十数軒の専売店)、Rolex(ロレックス)中国の従業員の数は300人を超え。[/url]
[url=http://www.ooowatch.com/tokei/chopard/index.html]時計スーパーコピー専門通販店,お客様非常に満足ブランドコピー時計 おすすめロレックス デイトナ コピー、プラダ カナパ コピー、エルメス バーキン コピー等のスーパーコピー通販専門店です。当店はロレックス デイトナスーパーコピー、ルイヴィトン 財布 コピー、ルイヴィトン 財布 スーパーコピーをはじめブランド時計、バッグ、財布偽物の外観から細部まで本物と同様です。驚きの低価格でロレックス デイトナ コピー時計、エルメス バーキン コピーを通販します。更に2年無料保証です。ルイヴィトン 財布 スーパーコピー等の新品、高い品質、激安 、送料は無料です(日本国内)!ブランドコピーならお任せ!ロレックス デイトナスーパーコピー,ロレックス デイトナ コピー,プラダ カナパ コピー,ルイヴィトン 財布 コピー,ルイヴィトン 財布 スーパーコピー,エルメス バーキン コピー,時計スーパーコピー,スーパーコピー[/url]
[url=http://www.wtobrand.com/otyj14.html]スーパーコピーブランド格安販売店はこちらへ!品々の激安価格に持ったスーパーコピーブランド 代引きの新作はお客様に提供されます。安心、迅速、確実、お客様の手元にお届け致します。★弊社は9年の豊富な経験と実績を持っております。★一流の素材を選択し、精巧な作り方でまるで本物のようなな製品を造ります。★品質を重視、納期も厳守、お客様第一主義を貫きは当社の方針です。★驚きの低価格で商品をお客様に提供致します!★早速に購入へようこそ![/url]