In facilities operations, the understanding of where the process is on a phase diagram can often help the engineer and operator to avoid extremely embarrassing design and operating mistakes. A phase diagram is a function of only mixture compositions and components. Though it is expensive and time consuming, a phase envelope can be determined experimentally by measuring a series of bubblepoints and dewpoints. Typically, a phase envelope is generated with a process simulator for specified mixture compositions. For a sensitive process, which requires an accurate phase envelope, some lab or field measured VLE (Vapor-Liquid-Equilibria) data may be required for tuning the equation of state (EOS).
Process simulation programs typically don’t have a utility or analysis tool to add isothermal and isobaric retrograde curves to a phase diagram. This tip presents two methods for how a process simulation program can be used to quantitatively determine the isothermal and isobaric retrograde curves. A phase diagram, including the retrograde curves for rich gas, is generated and presented.
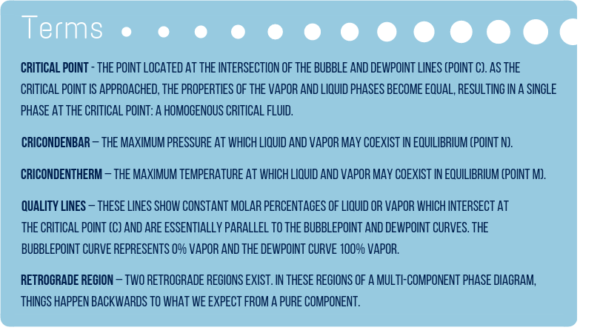
Figure 1 from Volume 1 of Gas Conditioning and Processing [1] shows the qualitative phase envelope for a natural gas mixture. Reference [1] also presents the terms used to define the location of various points on the phase envelope. A selection of these terms is listed here.


Figure 1. Typical phase diagram for a multi-component natural gas mixture [1]
The blue area represents isothermal retrograde, where liquid condenses when pressure decreases. This is what happens in the path A to B to D. The condensation begins at point B and the maximum liquid occurs at point D well below the pressure that liquids first start to form. This phenomenon occurs in most naturally occurring natural gas mixtures. We make use of this phenomenon to choose the best operating pressures for our production equipment.
The green shaded area represents isobaric retrograde vaporization. In this area, liquid vaporization occurs as temperature decreases or the amount of liquid decreases as we decrease temperature. If we come into the phase envelope from the other side, the amount of liquid increases as we increase temperature.
In facilities operations, the understanding of where the process is on a phase diagram can often help the engineer and operator to avoid extremely embarrassing design and operating mistakes [2]. A phase diagram is a function of only mixture compositions and components. Though it is expensive and time consuming a phase envelope can be determined experimentally by measuring a series of bubblepointsand dewpoints. Typically a phase envelope is generated with a process simulator for specified mixture compositions. For a sensitive process, which requires an accurate phase envelope, some lab or field measured VLE (Vapor-Liquid-Equilibria) data may be required for
Process simulation programs typically don’t have a utility or analysis tool to add isothermal and isobaric retrograde curves to a phase diagram. This tip presents two methods on how to process a simulation program can be used to determine quantitatively the isothermal and isobaric retrograde curves. To demonstrate the procedure the phase diagram including the retrograde curves for a rich gas is generated and presented.
Determination of Retrograde Curves
Table 1 presents a rich natural gas mixture composition used in this tip. The PR EOS (Peng-Robinson) equation of state [4] with its ProMax [5] default binary interaction parameters were used.
Table 1. Natural gas composition

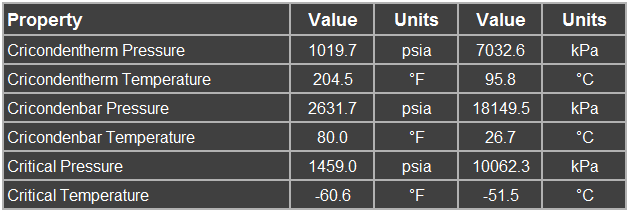
Table 2 and Figure 2 present the calculated properties and generated phase envelope for the mixture in Table 1 by ProMax [5].
Table 2. ProMax (PR EOS) calculated properties for the natural gas mixture of Table 1

Note Figure 2 does not illustrate the two retrograde regions. This is true for other process simulation programs. The step-by-step procedures to calculate the isothermal retrograde condensation and isobaric retrograde vaporization curve are presented in the following section.

Figure 2. Phase diagram by ProMax (PR EOS) for the natural gas mixture of Table 1
METHOD 1: Isothermal Retrograde Condensation (isoT RG) Curve
The curve connecting points M, D, and C in the blue region of Figure 1 is the isothermal retrograde curve. This curve presents the locus of maximum liquid formation for each isotherm between the critical (Point C) and cricondentherm (Point M) temperatures. For a specified temperature and an estimate of pressure as an initial guess, the maximum liquid formation is calculated by adjusting the pressure using the Solver tool in ProMax or similar tool in other software.
1. Calculate a step change for temperature, ΔT = (Cricondentherm T- Critical T)/N, N= ~ 20
2. Select the first temperature, e.g. T1= (Cricondentherm T) – ΔT
3. Use Solver tool to find the corresponding pressure, which maximizes the liquid formation
4. Record the specified temperature and calculated pressure corresponding to the maximum liquid formation
5. Select subsequent temperature I, e.g. TI = TI-1 – ΔT, and repeat steps 3 and 4 till the critical temperature is reached.
6. Plot the recorded pressures and temperatures on the phase diagram
The above procedure was executed by defining a simple process flow diagram presented in Figure 3A (isoT RG). The feed composition, flow rate (100 moles), specified temperature, and the initial estimate of pressure are defined in stream 1. The pressure drop in XCHG-100 was set equal to zero. Stream 2 temperature was set equal to stream 1 temperature. Using the Solver tool, stream 2 pressure was adjusted to maximize the liquid formation (this was done by minimizing negative of liquid formation fraction). Table 3 presents the results for a sample calculation.

Figure 3. Simple process flow diagrams for isothermal retrograde (A. isoT RG) and isobaric retrograde (B. isoB RG) curve calculations
Table 3. Single point sample calculation for isoT RG curve.

Note: * Initial Estimates, ** Calculated Values
The calculated isothermal retrograde condensation (isoT RG) curve is illustrated on the phase diagram of Figure 4. Note as the critical point was approached better estimate of pressures were needed to achieve convergence. Therefore, a few point calculations were done manually.

Figure 4. Phase diagram with isothermal retrograde condensation (isoT RG) curve for the natural gas mixture of Table 1
METHOD 1: Isobaric Retrograde (isoB RG) Curve
The curve connecting points M and C in the green region of Figure 1 is the isobaric retrograde curve. This curve presents the locus of maximum liquid formation for each isobar (P) between the critical (Point C) and cricondenbar (Point N) pressures. For a specified P and an estimate of T as initial guess, the maximum liquid formation is calculated by adjusting the T.
1. Calculate a step change for P, ΔP = (Cricondenbar P- Critical P)/N, N= ~ 20
2. Select the first pressure, e.g. P1= (Cricondentherm P) – ΔP
3. Use the Solver tool to find the temperature which maximizes the liquid formation fraction
4. Record the specified pressure and the calculated temperature
5. Select subsequent pressure for point I, e.g. PI = PI-1 – ΔP, and repeat steps 3 and 4 till the critical pressure is reached
6. Plot the recorded pressure and temperatures on the phase diagram
The above procedure was executed by defining a simple process flow diagram presented in Figure 3B (isoB RG). The feed composition, flow rate (100 moles), specified pressure, and the initial estimate of temperature are defined in stream 3. The pressure drop in XCHG-101 was set equal to zero, which resulted in the same pressure for streams 3 and 4. Using the Solver tool, stream 4 temperature was adjusted to maximize liquid formation (this was done by minimizing negative of liquid formation fraction). Table 4 presents a sample calculation results. The calculated isobaric retrograde vaporization (isoB RG) curve is illustrated on the phase diagram of Figure 5.
Table 4. Single point sample calculation for isoB RG curve.

Note: * Initial Estimates, ** Calculated Values

Figure 5. Phase diagram with isothermal (isoT RG) and isobaric (isoB RG) curve for the natural gas mixture of Table 1
METHOD 2: Isothermal Condensation and Isobaric Retrograde Vaporization Curves
In this method, the process simulation program can be used to generate a series of constant liquid (or vapor) quality curves. Figure 5 presents the phase envelope generated by the SRK (Soave-Redlich-Kwong) [6] EOS of EzThermo program [7] and the constant liquid quality curves for 30%, 25%, ….5%, and 2.5% L (liquid) curves. Each constant quality curve has its own cricondentherm and cricondenbar points. Note the isothermal retrograde (diamond symbol) curve passes through each constant quality curve cricondentherm and the isobaric retrograde (triangle symbol) curve passes through each constant quality curve cricondenbar. The properties of the critical point, cricondentherm, and cricondenbar by EzThermo are presented in Table 5. Note that these properties are slightly different from those calculated by the PR EOS of ProMax presented in Table 2 (due to different programs, EOS, and the binary interaction parameters).

Figure 6. Phase diagram with isothermal (isoT RG) and isobaric (isoB RG) curve for the natural gas mixture of Table 1 [7]
Table 5. EzThermo (SRK EOS) calculated properties for the natural gas mixture of Table 1

The generated phase diagram including the isothermal retrograde curve with a single run by EzThermo (SRK EOS) is presented in Figure 7. Note the retrograde curve does not approach the critical point correctly.

Figure 7. Phase diagram by EzThermo (SRK EOS) with iso T RG for the natural gas mixture of Table 1
Conclusions
Process simulation programs typically generate phase envelopes without the option to add the isothermal and isobaric retrograde curves. This tip presented two methods of utilizing a process simulation program for quantitative calculations of the isothermal and isobaric retrograde curves. To demonstrate the procedure two diagrams (Figures 5 and 6) including the retrograde curves for a rich gas were presented. The proposed procedure requires several steps but can be incorporated in an excel file linked to the process simulator.
Ideally, it will be helpful if process simulation programs add these features to their phase envelope utilities/analysis tools.
To learn more about similar cases and how to minimize operational problems, we suggest attending ourG4 (Gas Conditioning and Processing), and G5 (Practical Computer Simulation Applications in Gas Processing) courses.
By: Dr. Mahmood Moshfeghian
Sign up to receive Tip of the Month email updates below!
References
1. Campbell, J.M., Gas Conditioning and Processing, Volume 1: The Basic Principles, 9th Edition, 2nd Printing, Editors Hubbard, R. and Snow–McGregor, K., Campbell Petroleum Series, Norman, Oklahoma, 2014.
2. Lilly, L., “Why do I care about phase diagrams?”, PetroSkills June 2005 TOTM.
3. Moshfeghian, M., ”Selecting the correct phase envelope”, PetroSkills Nov 2005 TOTM.
4. Peng, D. Y., and Robinson, D. B., Ind. Eng. Chem. Fundam., Vol. 15, p. 59, 1976.
5. ProMax 4.0, Build 4.0.17179.0, Bryan Research and Engineering, Inc., Bryan, Texas, 2017.
6. Soave, G., Chem. Eng. Sci. Vol. 27, No. 6, p. 1197, 1972.
7. EzThermo, Moshfeghian, M. and Maddox, R. N., 2008.

Table 2 and Figure 2 values don’t match
Yes, this has been corrected. Thank you for the feedback.
I wԝas loρoking at some of your articleѕ on this internet site and I conceive this site is ггeal informativе!
Continue putting up.