►Watch Mick Crabtree’s Harnessing Coriolis Webinar
It was not until Gaspard-Gustav de Coriolis published a paper in 1835 that the terms Coriolis Effect andCoriolis Force were actually coined [1]. Nonetheless, the effect had been described by the Italian scientist Giovanni Riccioli in 1651 who postulated that if, in the astronomical model of the solar system, the Earth rotated around the Sun (as heliocentrics believed) a cannonball fired towards the north pole should cause it to deflect to the east. Since, at that time, this was not an observable effect it was used as an argument for geocentrism, which placed the Earth at the center.
In recent years, the major impact of the Coriolis Effect has been in the field of meteorology – describing how it affects global wind patterns – with cyclonic rotation having an anti-clockwise direction in the northern hemisphere and clockwise direction in the southern hemisphere.
But the practical application of the Coriolis effect in the field of engineering has been in mass flow measurement.
Mass flow is a primary unit of flow measurement and is unaffected by viscosity, density, conductivity, pressure and temperature. As a result, it is inherently more accurate and meaningful for measuring material transfer. Furthermore, most chemical reactions are based largely on their mass relationship. Consequently, by measuring the mass flow of the product it is possible to control the process more accurately.
Traditionally, the measurement of mass flow entailed measuring the volumetric flow rate and multiplying it by the measured density – normally achieved through the use of expensive, imprecise and potentially dangerous nuclear-based densitometry. In contrast, Coriolis-based metering measures mass flow directly.
The Coriolis force:
Consider two children, Anne and Belinda, playing on a children’s roundabout (Figure 1) which is rotating at a constant angular velocity [2][3]. Anne is situated mid-way between the axis and the outer edge of the platform while Belinda is sat at the outer edge itself. If Anne now throws a ball directly to Belinda, Belinda will fail to receive the ball!

Figure 1. Anne and Belinda are playing on a children’s roundabout. If Anne throws a ball directly to Belinda, Belinda will fail to receive the ball due to the Coriolis effect.
The fact is that whilst Anne and Belinda both have the same angular velocity their tangential velocities are different (Figure 2). Anne’s tangential velocity (VA) is only half of Belinda’s tangential velocity (VB). In fact, the peripheral speeds of each are directly proportional to the radius i.e.:


Figure 2. Belinda, at the edge of the platform, will have a peripheral speed of twice that of Anne and thus the ball’s peripheral speed needs to be accelerated from VA to VB .
Consequently, to move the ball from Anne to Belinda its tangential velocity needs to be accelerated from VA to VB. This acceleration is a result of what is termed the Coriolis force, named after the French scientist who first described it and is directly proportional to the product of the mass in motion, its speed and the angular velocity of rotation:


Looking at this from another point, if we could measure the Coriolis force (Fcor), knowing the tangential velocity (v) and the angular velocity we could determine the mass (m) of the ball.
How does this relate to mass measurement of fluids?
Consider a liquid-filled pipe sealed at both ends, rotating about an axis at an angular velocity (w).
The tangential velocity (v) of any individual particle of the fluid is simply the angular velocity (w) times the distance (r) from the centre of rotation (Figure 3). Thus, at distance r1, the tangential velocity of a particle would be r1.w whilst at double the distance r2, the tangential velocity would also double to r2.w.
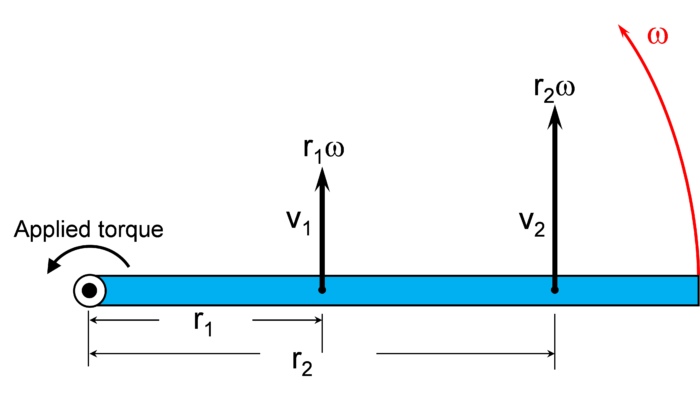
Figure 3. At distance r1, the tangential velocity of a particle would be r1.w whilst at double the distance r2, the tangential velocity would also double to r2.w.
If now, the liquid flows in a direction away from the axis (Figure 4), then as each mass particle moves, for example, from r1 to r2 it will be accelerated by an amount equivalent to its movement along the axis from a low to a higher tangential velocity. This increase in velocity is in opposition to the mass inertial resistance and is felt as a force opposing the pipe’s direction of rotation – i.e. it will try to slow down the rotation of the pipe. Conversely, if we reverse the flow direction, particles in the liquid flow moving towards the axis are forced to slow down from a high velocity to a lower velocity and the resultant Coriolis force will try to speed up the rotation of the pipe.
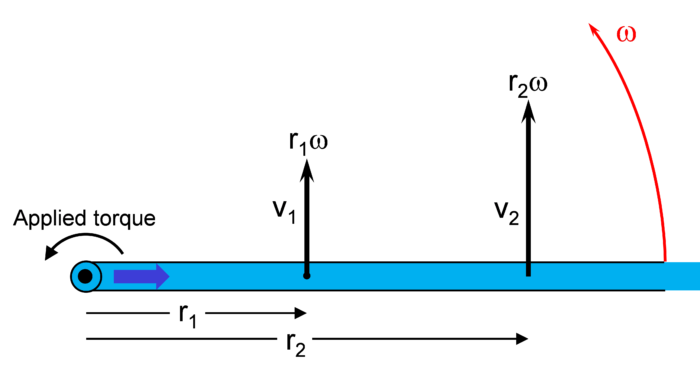
Figure 4. As the liquid flows away from the axis, each mass particle will be accelerated by an amount equivalent to its movement along the axis from a low to a higher orbital velocity.
Thus, if we drive the pipe at a constant torque, the Coriolis force will produce either a braking torque or an accelerating torque (dependent on the flow direction) that is directly proportional to the mass flow rate. In other words, the torque required to rotate the pipe will increase in direct proportion to the actual mass flow of the liquid.
Initial implementation:
The possibility of applying the Coriolis effect to measure mass flow rate was recognized many years ago and, as shown in Figure 5 [4], initial patents were registered in the early 1950’s. These were typically based on rotating systems typified by the radial-vane type meter (Figure 6).
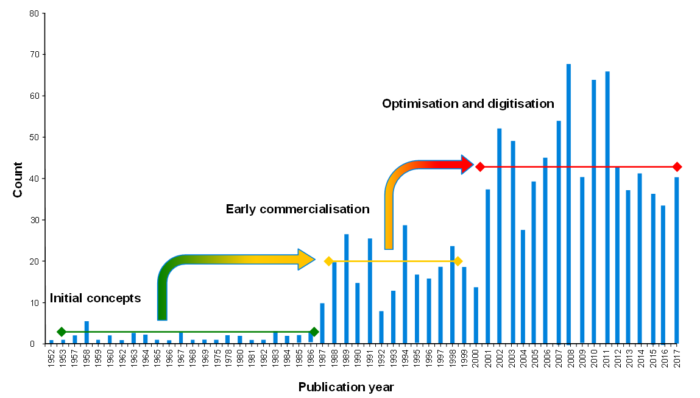
Figure 5. US Coriolis patent publications per year to November 2017 (© 2018 E. Jenks, Krohne Ltd.)
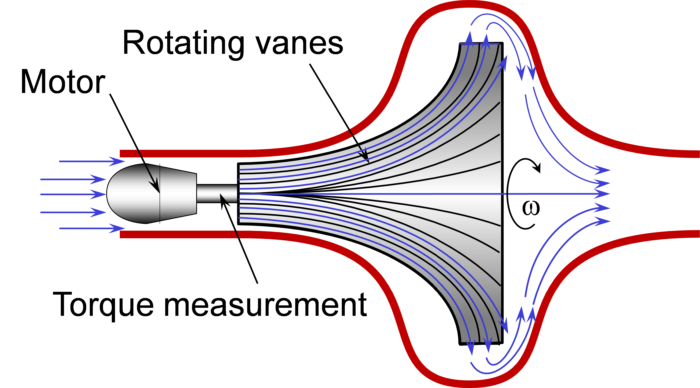
Figure 6. Radial-vane type meter
Here, the flowing fluid enters the center of a centrifugal pump-type impeller driven at a constant angular velocity (w). As the fluid’s tangential velocity (r.w) increases, it reacts on the impeller with a force directly proportional to the mass flow rate. This Coriolis force is measured by the torque measuring tube.
Obvious problems include:
►Maintaining the motor speed to provide a constant angular velocity (w).
►Slip rings for power and measurement of torque
►High unrecoverable pressure loss
►Wear and tear
It was not until 1977 that engineer and inventor Jim Smith, founder of Micro Motion, patented the first practical system. Rather than use rotational movement, this system was based on a vibrating tube system to provide oscillatory movement.
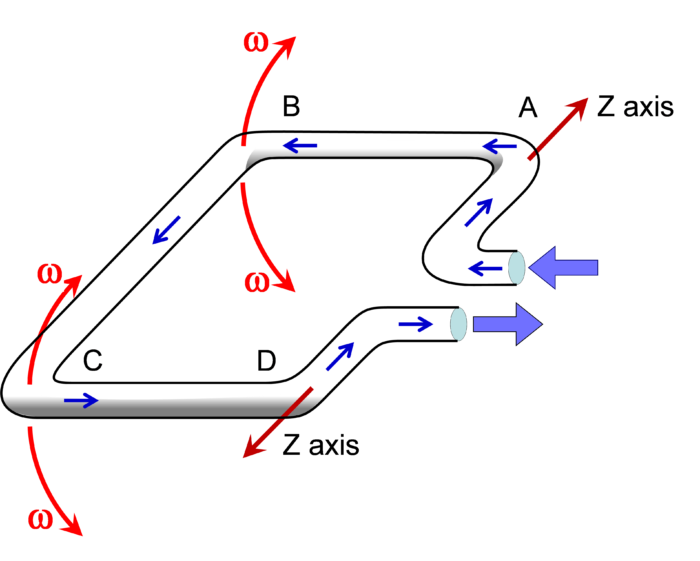
Figure 7. A pipe, formed in a loop, is vibrated around the z axis so that the straight parts of the pipe, A-B and C-D, oscillate on the arcs of a circle.
The basic principle is illustrated in Figure 7 in which a tubular pipe, carrying the liquid, is formed in a loop and vibrated around the z-axis. The straight parts of the pipe, A-B and C-D, oscillate on the arcs of a circle and without any flow will remain parallel to each other throughout each cycle.
If a liquid now flows through the tube in the direction shown, then the fluid particles in section A-B will move from a point having a low tangential velocity at A to a point having a high tangential velocity at B. This means that each mass particle must be accelerated in opposition to the mass inertial resistance. This opposes the pipe’s direction of rotation and produces a Coriolis force in the opposite direction. Conversely, in section C-D, the particles move in the opposite direction – from a point having a high tangential velocity at C to a point having a low tangential velocity at D.
The resultant effect of these Coriolis forces is to delay the oscillation in section A-B and accelerate it in section C-D. As a result, section A-B tends to lag behind the undisturbed motion whilst section C-D leads this position. Consequently, the complete loop is twisted by an amount that is directly and linearly proportional to the mass flow rate of the fluid – with the twisting moment lent to the pipe arrangement being measured by sensors.
Figure 8 (a) shows the oscillatory motion applied to a single tube whilst Figure 8 (b) shows the forces acting on the tube in which there is fluid flow. As a result, the complete loop is twisted by an amount that is directly and linearly proportional to the mass flow rate of the fluid (Figure 8(c)) – with the flexure of the pipe arrangement being measured by sensors.

Figure 8. (a) Oscillatory motion applied to a single tube. (b) Forces acting on the tube in which there is fluid flow. (c)Complete loop is twisted by an amount that is directly and linearly proportional to the mass flow rate of the fluid.
To reduce the risk of stress fractures the oscillation amplitude is limited to between 0.1 and 1 mm which, in an optimally designed system is about 20% of the maximum permitted value.
The distortion caused by the Coriolis forces is about 100 times smaller (a magnitude of about 10 mm), and in order to provide a measurement resolution to meet an accuracy of, for example, ±0.1% magnitudes of the order of a few nanometres would need to be resolved. The reality is we don’t actually measure the amplitude but the phase difference (i.e. time) with flexure of the pipe arrangement measured by velocity sensors (Figure 9).
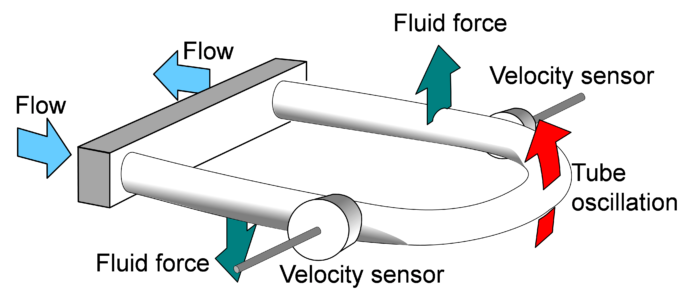
Figure 9. Flexure of the pipe arrangement measured by velocity sensors.
With no fluid flow (and thus no flexure) the sinusoidal outputs of the two velocity sensors would be in-phase – with no time difference (Figure 10 (a)). However, with fluid flow, the flexure of the pipe produces a phase difference directly proportional to the mass flow (Figure 10 (b)).

Figure 10. With no fluid flow, the sinusoidal outputs of the velocity sensors are in-phase – with no time difference (a). With fluid flow, the flexure of the pipe produces a phase difference directly proportional to the mass flow (b).
Measurement resolution of ± 0.1 % amounts to only a few ns. And in order to achieve an accuracy of ± 0.1 %, where the resolution needs to be typically 5 to 10 times higher, time shift difference measurements are required down to picosecond levels.
Density Measurement
The measurement of mass flow by the Coriolis meter is, fundamentally, independent of the density of the medium. However, the vibratory action of the oscillating tubes employed in the Coriolis meter can be harnessed to provide an independent measure of the medium density.
Hooke’s Law spring equation states that a mass suspended on a spring will oscillate at a resonant frequency:


This indicates that when the mass increases the natural frequency decreases and when the mass decreases the natural frequency increases.
How does Hooke’s Law relate to density measurement in a vibrating tube?
The mass of the system (m) equals the mass of the tube (mtube), which is fixed, plus the mass of the fluid in the tube (mfluid) – which is variable with the process:

In turn, the fluid mass (mfluid) is determined by the volume of the tube (Vtube), which is fixed, multiplied by the density of the fluid (ρfluid), which is variable.

Rearranging equations 3, 4 and 5:

With all other values constant, the density of the fluid (ρfluid) is inversely proportional to the square of the resonant frequency:

Consequently, by measuring this frequency we calculate the fluid’s density.
It is important to recognize that the density measurement is not based on the Coriolis effect but on the effect of the vibrating tube.
So, in addition to providing a direct indication of mass flow the oscillating pipe system also, independently, provides a direct indication of the density by tracking the resonant oscillation frequency. Obviously, the value of (k) in equation 6 above, hides a lot of dependencies – one of which is temperature. Consequently, the temperature must be measured as an independent quantity and used as a compensating variable. The temperature is also available as a measured output.
With knowledge of both the mass flow (Qm) and the density (r) of the fluid, it is now possible to also calculate the volumetric flow rate (Q) since:

From the foregoing, we can see the importance of vibrating the tubes at their resonant frequency. Furthermore, excitation at the resonant frequency requires less drive energy and ensures that excitation is in the primary resonant mode at all times.
This is accomplished through a simple feedback system from the pick-up coils (Figure 11).

Figure 11. Excitation at the resonant frequency is accomplished through a simple feedback system from the pick-up coils.
Moving forward
At the beginning of the 1980’s there was only one Coriolis meter manufacturer, but by 1990 there were more than 13 different manufacturers. And, as may be seen from Figure 5, the mid-1980s saw the start of a plethora of new designs – each one seeking to overcome the shortcomings of previous versions.
So what exactly were the major perceived shortcomings of this technology?
Not necessarily in order of importance:
►the bent tube design
►maximum pipe diameter
►entrained gas
Tube configurations
Maximising sensitivity, whilst simultaneously minimizing the effects of extraneous noise and vibration, led to a variety of different bent-tube designs. But the bent-tube arrangement, itself, produced problems.
In any arrangement requiring the tube to be bent the outside wall is stretched and becomes thinner whilst the inner wall becomes thicker. When the flowmeter requires two such convoluted tubes, it becomes difficult to balance them both dimensionally and dynamically.
Furthermore, if the fluid is abrasive, this already weakened part of the flowmeter is likely to be most severely stressed. Abrasive material can also cause erosion that will change the stiffness of the resonant elements and so cause measurement errors.
And for many liquids the resultant pressure drop, due to the bends, could result in flashing or even cavitation damage. Furthermore, some of the bent-tube configurations did not cater for self-draining – an important consideration in many industries including: food and beverage; pharmaceuticals; and chemical.
A typical dual bent-tube design, as shown in Figure 12, featured a high total cross-sectional area combined with the flexibility of two pipes. On the negative side, the flow divider introduced a high-pressure drop. In addition, the flow may not be equally divided, and the dual tube arrangement does not allow clean-in-place (CIP) to be implemented.
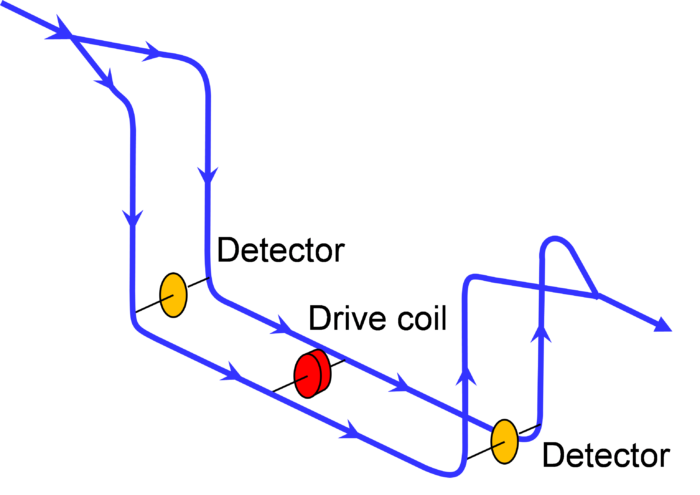
Figure 12. A typical dual bent-tube design.
And whilst the continuous loop configuration (Figure 13) caters for CIP, a larger cross-sectional area is required to reduce the pressure loss. This leads to increased rigidity – making it less sensitive at low rates.
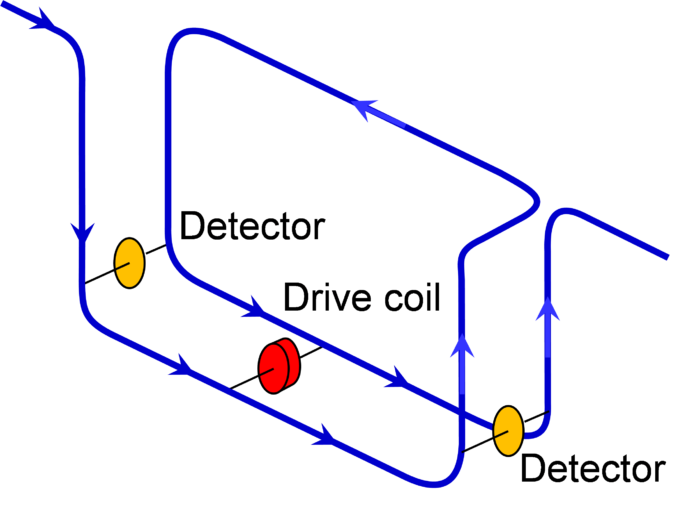
Figure 13. Continuous loop configuration.
Other designs proliferated (Figure 14) [5].
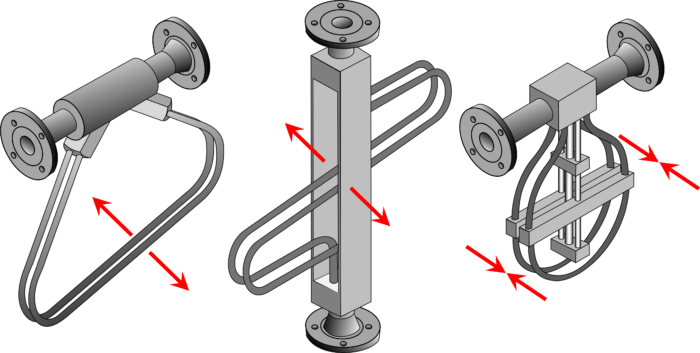
Figure 14. A variety of dual bent-tube designs.
However, the next major milestone occurred with the first straight-tube design introduced in 1986 by Endress+Hauser (Figure 15).
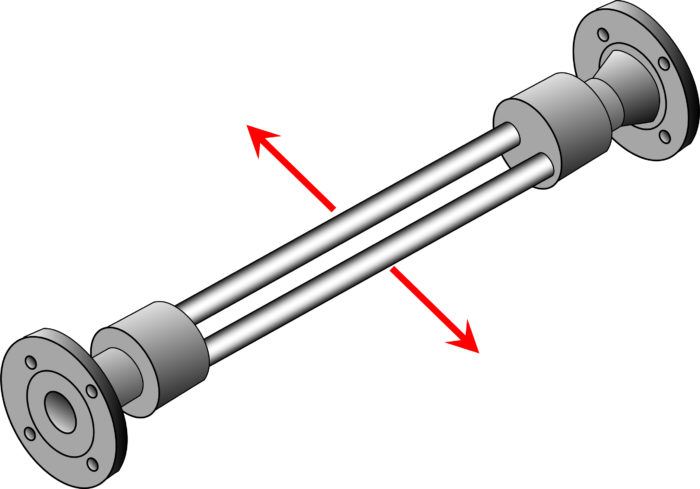
Figure 15. Straight-tube design employing dual measuring tubes.
With no flow, flexure of the tubes takes place in the vibrational plane (Figure 16 (a) and (b)). However, in the event of fluid flow, the Coriolis forces acting on the tubes produce a distorted flexure which is detected by the sensors (Figure 16 (c) and (d)).

Figure 16. With no flow, flexure of the tubes takes place in the vibrational plane ((a) and (b)). However, in the event of fluid flow the Coriolis forces acting on the tubes produce a distorted flexure which is detected by the sensors ((c) and (d)). (Courtesy Endress + Hauser).
But whilst this design overcame the problems associated with having a bent tube (weakening of the tubes at the bends, erosion, flashing) it’s still employed dual measuring tubes with the need to split the flow. This limitation was surmounted when, in 1994, Krohne introduced the world’s first industrial single straight tube meter.
However, these straight tube designs also brought in their wake several other problems. Whereas the flexibility of the bent tube arrangement easily allowed for expansion and contraction due to temperature and/or pressure variations, the rigidity of the straight tube design is less forgiving. Consequently, the use of strain gauge technology became mandatory in order to detect the slight variations in the dimensional changes of the tubes. How these measurements were incorporated to provide accurate compensation became the subject of complex algorithms.
Early designs were constrained to a maximum pipeline diameter of typically 25 to 50 mm (1 to 2”) which severely limited their application. However, incrementally this limit has been extended until, only late last year, 400 mm (16”) pipeline diameter straight tube system [6].
MEMS-based technologies
At the other end of the scale, there has been a growing demand for micro-dosing in the pharmaceutical and silicon fabrication industries as well as in the laboratory sample analyzing and processing [7]. Whilst most Coriolis meters find their application in measuring flow rates greater than 1 kg/hr these industries require dosing and a measuring rates in the order of 1 g/hr and lower.
These challenges have been met through the application of MEMS-based technologies (Micro Electro Mechanical Systems) in which the entire mechanical Coriolis fluidic sensing system is integrated into a single silicon microchip Figure 17.

Figure 17. Complete Coriolis fluidic sensing system integrated into a single silicon microchip (courtesy Integrated Sensing Systems)
Whilst some of these designs have focussed on flow measurement at very-low flow rates (down to 10 mg/h or better) other designs have been mainly developed to measure gas density and concentration [8].
At first glance, the use of silicon to fabricate the actual vibrating sensing tubes might seem at odds with its inherent rigidity, as compared with metals that can bend. Nevertheless, whilst a metal tube will plastically deform over time when exposed to fatigue when a silicon structure is bent it either goes back to its original position or it breaks. Consequently, because it never deforms, it is virtually free of fatigue, hysteresis anddrift.
Another benefit of silicon is the resonant frequency of the vibrating tube. Conventional metal tube Coriolis mass flow meters resonate at 100 to 1500 Hz [9,10] leaving them susceptible to the spectrum of common external mechanical vibration and shock frequencies that are under 2000Hz.
The micro-tube resonant frequency of silicon, on the other hand, is high (typically of the order of 20 kHz) making it virtually impervious to any form of extraneous vibration.
A third advantage of silicon over steel is that its density is 3.4 times lower. Thus, whilst conventional Coriolis flow sensors manufactured from steel are typically not sensitive enough to accurately measure gas density at low pressures, a significantly higher sensitivity can result from the use of silicon.
Towards the perfect flow meter
There have been other challenges. For example, custody flow measurement of Liquefied Natural Gas (LNG) requires the system can operate down to -165°C – a severe challenge in terms of material embrittlement. But this challenge has been met and overcome and Coriolis metering for LNG is starting to become standard practice.
In earlier designs, the liquid to gas ratio was confined between 4 and 6%. Newer models, employing a number of innovative designs, maintain active measurement in all measuring conditions with gas content from 0 to 100% by volume [11].
So how far along the road are we towards the perfect flow meter? Although it is doubtful that there will ever be a ‘one-size-fits-all’ solution, flow metering based on the Coriolis effect provides an almost universal range of answers.
However, in a recent article Eric Heilveil [12] stated: “The first barrier to Coriolis world domination can be summed up in a single word … price. A one-inch line magnetic flowmeter and transmitter, for example, can be had for $3000 or less. A comparably sized Coriolis meter can run upwards of $9000 or more.”
But let us rather recall the words of John Ruskin: “There is hardly anything in the world that some man cannot make a little worse and sell a little cheaper, and the people who consider price only are this man’s lawful prey.”
To learn more about similar cases and how to minimize operational problems, we suggest attending ourIC-3 (Instrumentation and Controls Fundamentals for Facilities Engineers), IC-71 (PLC and SCADA Technologies) and IC-72 (Valve and Actuator Technologies) courses.
By: Michael A. Crabtree
Sign up to receive Tip of the Month emails below!
References:
[1] https://en.wikipedia.org/wiki/Coriolis_force
[2] M. A. Crabtree, ‘Mick Crabtree’s Flow Handbook – 2nd Edition’, Crown Publications cc, 2000.
[3] M. A. Crabtree, ‘Industrial Flow Measurement’, Masters Thesis, University of
Huddersfield, 2009.
[4] E. Jukes, ‘Optimass Product Group Presentation’, Krohne Ltd. 2018
[5] Rheonik, ‘RHM 160 – 12 Coriolis Mass Flowmeter’, Page 5 of 5, v6, April 2006.
[6] ‘New large line size Coriolis mass flowmeters’, Press release, Krohne Ltd. 2017
[7] C. Huber, ‘MEMS-based Micro-Coriolis Density and Flow Measurement Technology’
Endress+Hauser Flowtec AG, Proceedings AMA Conferences, 2015.
[8] A. Rieder, (Endress+Hauser GmbH), Paul Ceglia, (Endress+Hauser Flowtec) AG, ‘New generation vibrating tube sensor for density measurement under process conditions’,
2017.
[9] N. Najafi, M. Putty, R. Smith ‘Coriolis MEMS-sensing technology for real-time fluidic measurements’, Integrated Sensing Systems, (ISS), reprinted from ‘Flow Control’ May 2017
[10] W. Sparreboom, ‘Miniaturization to the Extreme: Micro-Coriolis Mass Flow Sensor’, Bronkhorst High-Tech B.V. January 30, 2018..
[11] H. Zhu, A. Rieder, ‘An innovative technology for Coriolis metering under entrained gas conditions’, Endress+Hauser Flowtec AG, 2016.
[12] E. Heilveil, ‘Three Dirty Little Secrets about Coriolis Flow Meters’, Siemens Industry Inc. July 2017
