In the past Tips of the Month (TOTM), we discussed the phase behavior of sweet natural gas- water, sour natural gas-water, and acid gas–water systems. They were posted in October 2007 TOTM [1], November 2007 TOTM [2], and December 2007 TOTM [3], respectively. In this TOTM, we will revisit the acid gas-water phase behavior system. Specifically, different methods of predicting water content of acid gas systems are evaluated based on experimental data from the literature. Water content diagrams compatible with the experimental data for pure CO2, Pure H2S, pure CH4 and their mixtures are generated and presented. These charts can be used for facility type calculations and trouble shooting.
Table 1 presents the compositions of several acid gas mixtures evaluated in this study, along with their saturated water contents (in mole percent) from experimental data [4] and from predictions by five methods. The Maddox et al. [5] results were generated using GCAP [6] software and the Erbar et al. [7] results were generated by EzThermo [8] software. The Wichert & Wichert [9] and Yarrison et al. [10] results are from GPA RR-210 [11]. The last column presents the results predicted by SRK in ProMax [12].
Table 1 indicates that as long as the total acid gas concentrations is less than 60 mole percent, all five methods produce results within the accuracy of experimental data. However, for higher concentrations of acid gases, the Yarrison et al. [10] and ProMax [12] methods provide more accurate results.

It should be noted that the results of ProMax in Table 1 are based on the water saturator tool available in ProMax. If a conventional 3-phase separator calculation of ProMax is used, the error percent for the third row from the bottom of table reduces from -44.9 % to -16.6 %. The results for the other cases remained practically the same for these two calculations options.
Table 2 and Figure 1 present the error analysis for prediction of 74 additional gas mixtures containing acid gases. The detail of data points and sources of experimental points are in GPA RR-210 [11]. The five methods under study are Maddox et al. [5], Robinson et al. [13], Wichert & Wichert [9], Yarrison et al. [10], and ProMax [12]. With the exception of the ProMax results, the predicted water contents used for error analysis of the other four methods were extracted from GPA RR-210 [11].

Figure 1 presents the error analysis graphically for the same 74 gas mixtures presented in Table 2. Based on the error analysis of Tables 1, 2, and Figure 1, the ProMax method was chosen to generate water content diagrams for pure CO2, pure H2S, and their mixtures. These diagrams are presented in the proceeding sections.

The phase equilibria in the system H2S + water and CO2 + water are key to the discussion of the water content of an acid gas system. Figures 2 (SI) and 2 (FPS) present the water content of pure H2S predicted by ProMax [12] as a function of pressure and temperature, in the international system (SI) and engineering system of units (FPS, foot, pound and second). The behavior shown on this plot is quite complicated and explained thoroughly by Carroll [14]:
“At low pressure the hydrogen sulfide + water mixture is in the gas phase. At low pressure the water content tends to decrease with increasing pressure, which is as expected. Eventually a pressure is reached where the H2S is liquefied. On this plot this is represented by the discontinuity in the curve and a broken line joins the phase transition. There is a step change in the water content when there is a transition from vapor to liquid. In the case of hydrogen sulfide the water content of the H2S liquid is greater than the coexisting vapor. This is contrary to the behavior for light hydrocarbons where the water content in the hydrocarbon liquid is less than the coexisting vapor.”
Within the transition region, the acid gas exists as both liquid and vapor. Water saturation of the vapor phase is represented by the lower value, whereas the water content of the liquid phase is the higher value.
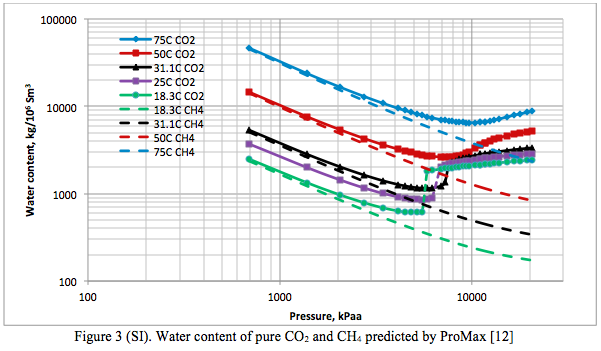
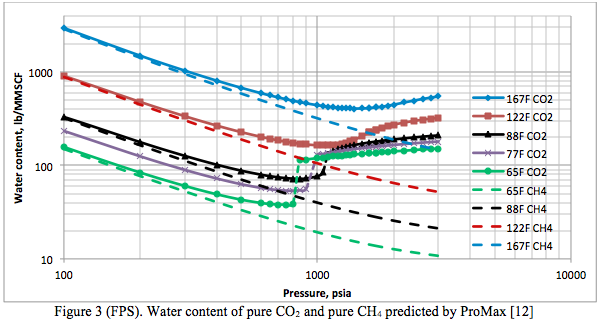
Figures 3 (SI) and 3 (FPS) present the water content of pure CO2 and pure CH4 predicted by ProMax [12] as a function of pressure and temperature, in the international system (SI) and engineering system of units (FPS). When Figures 2 and 3 were superimposed on Figures 20-5 and 20-6, respectively, of the GPSA data book [15] a very good match was obtained. The two figures in the GPSA data book are based on experimental data and the Yarrison et al. model.
In general the phase behavior of the system CO2 + water is as complex as that of the H2S + water system. The CO2-rich liquid phase only occurs for temperatures less than about 32.2°C (90°F). As shown in Figure 3 (as well as in Figure 2 reported by Maddox and Lilly [16]), the water content of CO2 exhibits a minimum.
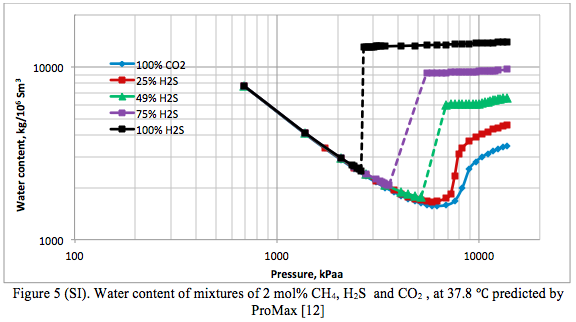
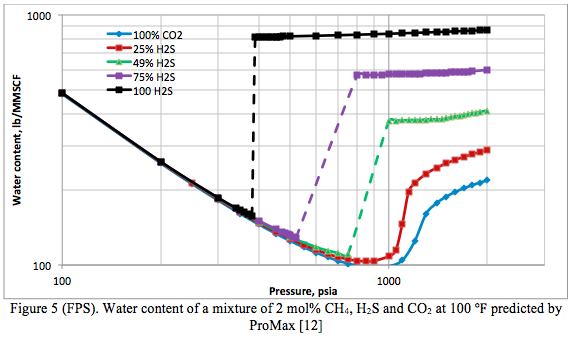
Figure 4 presents the phase behavior of pure CO2, Pure H2S and three mixtures of them containing 2 mole percent CH4. Their corresponding water content charts are presented in Figure 5.


Summary:
There are several methods available that can be used to predict the water content of acid gases. Most of these methods are based on equations of state and rigorous thermodynamic models. As described above, the phase behavior is complicated and extra care should be taken to assure a correct prediction. Although not addressed in this study, hydrates can also form and these can significantly complicate phase behavior.
Different methods of predicting water content of acid gas systems are evaluated based on the literature experimental data. In addition, the water content diagrams compatible with the experimental data for pure CO2, H2S, CH4 and their mixture are generated and presented. These charts can be used for facility type calculations and trouble shooting.
To learn more, we suggest attending our G40 (Process/Facility Fundamentals), G4 (Gas Conditioning and Processing), G5 (Gas Conditioning and Processing-Special), and PF81 (CO2 Surface Facilities), PF4 (Oil Production and Processing Facilities), courses.
John M. Campbell Consulting (JMCC) offers consulting expertise on this subject and many others. For more information about the services JMCC provides, visit our website at www.jmcampbellconsulting.com, or email us at consulting@jmcampbell.com.
References:
- Moshfeghian, M. “Water-Sweet Natural Gas Phase behavior,” http://www.jmcampbell.com/tip-of-the-month/2007/10/water-sweet-natural-gas-phase-behavior/, October 2007.
- Moshfeghian, M., ”Water-Sour Natural Gas Phase Behavior,” http://www.jmcampbell.com/tip-of-the-month/2007/11/water-sour-natural-gas-phase-behavior/, November 2007.
- Wright, W. and M. Moshfeghian, “Acid Gas-Water Phase Behavior,” http://www.jmcampbell.com/tip-of-the-month/2007/12/acid-gas-water-phase-behavior/, December, 2007.
- Huang, S.S.S., A.D. Leu, H.J. Ng, and D.B. Robinson, “The Phase Behavior of Two Mixtures of Methane, Carbon Dioxide, Hydrogen Sulfide, and Water” Fluid Phase Equil. 19, 21-32, 1985.
- Maddox, R.N., L.L. Lilly, M. Moshfeghian, and E. Elizondo, “Estimating Water Content of Sour Natural Gas Mixtures”, Laurance Reid Gas Conditioning Conference, Norman, OK, Mar., 1988.
- GCAP 8.3, John M. Campbell & Co., Norman, Oklahoma, December 2010.
- Erbar, J.H., A.K. Jagota, S. Muthswamy, and M. Moshfeghian, “Predicting Synthetic Gas and Natural Gas Thermodynamic Properties Using a Modified Soave-Redlich-Kwong Equation of State,” Gas Processor Research Report, GPA RR-42, Tulsa, USA, 1980.
- EzThermo, Chemical Engineering Consultants, Inc, Stillwater, Oklahoma, 2010.
- Wichert, G. C. and E. Wichert, “New Charts Provide Accurate Estimation for Water Content of Sour Natural Gas”, O&G J, pp 64-66, Oct. 27, 2003..
- Yarrison M., Song, K. Y., Cox, K,, Chronister D. and Chapman, W., “Water Content of High Pressure, High Temperature Methane, Ethane and Methane+CO2, Ethane + CO2,” RR-200, GPA, Tulsa, OK, March, 2008.
- Song, K. Y., Vo, T., Yarrison M. and Chapman, W., “Acid Gas Water Content, An Update Of Engineering Data Book I,” RR-210, GPA, Tulsa, OK, June, 2012.
- ProMax 3.2, Bryan Research and Engineering, Inc., Bryan, Texas, U.S.A., 2013.
- Robinson, J. N., et al., Trans. AIME, Vol. 263, p. 281, 1977
- Carroll, J.J., “The water content of acid gas and sour gas from 100 to 220 °F and pressures to 10,000 Psia,” Presented at the 81st Annual GPA Convention, Dallas, Texas, USA, March 11-13, 2002.
- GPSA Data Book, Vol. 2, 13th Ed., Gas Processors and Suppliers Association, Tulsa, Oklahoma, 2013.
- Maddox, R.N., L.L. Lilly, “Gas conditioning and Processing, Vol 3: Computer Applications and Production/Processing Facilities”, John M. Campbell & Company, Norman, USA, 1982.

Dear Sir/Madam
Greetings !
I’m interested to get the tip of the month by email.
Appreciate your kind response.
Thanks & Best Regards
Sanjay Shenoy
Dear Sir/Madam
I’m also interested to get the tip of the month by email.
Appreciate your kind response.
Thanks & Best Regards
Dear sir / Madam,
I would like to receive the TIP OF THE MONTH from you through mail. I would like to know and understand more about gas processing techniques alongwith safety precautions.
I would be grateful for your advice and response.
Thanks and regards.
K.NARAYANAN
SR. MANAGER – OPERATION & MAINTENANCE
+91449840466034.
i would like to receive the tip of the month. i will enjoy one of your courses this summer in London
Greetings!
If each of you would like to send me your email address and name, I will gladly sign each of you up to receive the Tip of the Month via email.
Dear Hailey
Greetings !
I’m interested to get the tip of the month by email.
Appreciate your kind response.
Thanks & Best Regards
Sanjay Shenoy
Hello,
If you both could send me your email addresses, I will get you signed up for the Tip of the Month.
Please send your information to: hailey.thomas@petroskills.com
Thanks!
greetings!
i would like to receive the tip of the month- as I found it very informative and useful
[…] http://www.jmcampbell.com/tip-of-the-month/2014/02/acid-gas-water-content/ […]
hello Sir/madam
welcome!
i might want to get the tip of the month-as I thought that it was extremely useful and helpful