In the past Tips of the Month (TOTM), we discussed the phase behavior and water content of lean sweet, sour natural gases and acid gases–water systems. Specifically, in the November 2007 [1], February 2014 [2], and September 2014 [3] Tips of the Month (TOTM), we discussed the phase behavior of water-saturated sour gases and acid gases. We also demonstrated the accuracy of shortcut and rigorous calculation methods. In the April 2015 TOTM [4] we introduced correlation and graphs to estimate the water content of sour gases.
In this TOTM, we will study the effect of relative density (Specific Gravity, SG) on the saturated water content of sweet natural gases. The results of this study include the water content of sweet natural gases as a function of relative density in the range of 0.60 to 0.80. Four temperatures of 4.4, 23.9, 37.8 and 149 °C (40, 75, 100, and 300 °F) were considered. For each temperature, the saturated water content was calculated for pressures of 1724, 3448, 6897, and 13 793 kPaa (250, 500, 1000 and 2000 psia).
Water Content Calculation
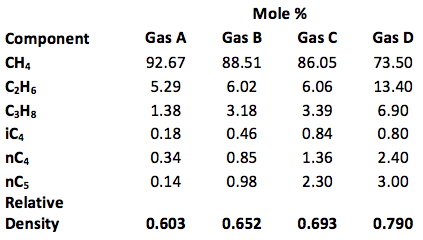
The dry gas compositions of the four mixtures studied in this study are presented in Table 1. The Soave-Redlich-Kwong equation of state (SRK EOS) [5] in the ProMax [6] was used to predict the water content of these gas mixtures at different pressures and temperatures. A simplified process diagram for this study is presented in Figure 1. The feed dry-gas at the specified pressure and temperature was saturated with water first and passed through a separator. The water content and specific gravity of vapor leaving the separator were recoded.
Results and Discussion
Figure 2 through 5 present the saturated water content of sweet natural gases as a function of the dry gas relative density and pressures of 1724 to 13793 kPaa (250 to 2000 psia) for temperatures of 4.4, 23.9, 37.8 and 149 °C (40, 75, 100, and 300 °F), respectively.
Table 1. The composition of relative density (Specific Gravity, SG) of the four gas mixture


Figure 1. Simplified process flow diagram

Figure 2. Variation of saturated water content of sweet natural gas with the dry gas relative density and pressure at 4.4 °C (40 °F)

Figure 3. Variation of saturated water content of sweet natural gas with the dry gas relative density and pressure at 23.9 °C (75 °F)

Figure 4. Variation of saturated water content of sweet natural gas with the dry gas relative density and pressure at 37.8 °C (100 °F)

Figure 5. Variation of saturated water content of sweet natural gas with the dry gas relative density and pressure at 149 °C (300 °F)
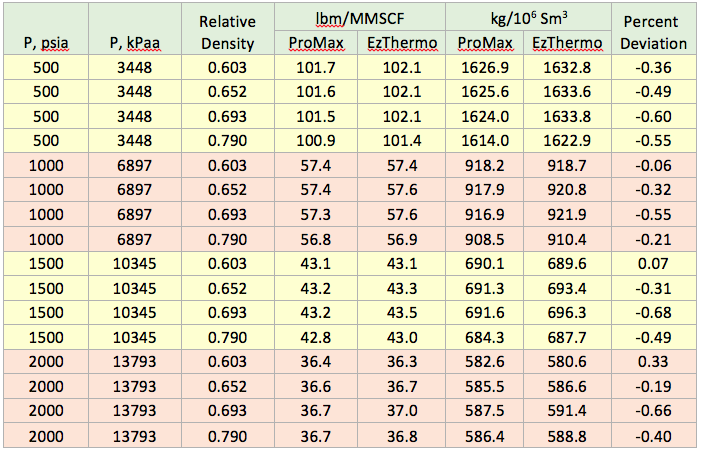
While the results presented in the above diagrams are in agreement with Figure 6.1 of Reference [7], it is not in agreement with the suggested correction factor in the inset of Figure 20-3 of the GPSA data book [8] and the results of Reference [9]. For the gases with relative density of 0.6 up to 0.8, the GPSA figure indicates a correction factor of 1 to about 0.97 should be multiplied by the water content of saturated water content of sweet gas with relative density of 0.6. This study indicates that for the range of 0.6 to 0.8 relative density, the water content is not a function of the hydrocarbon gas composition. To verify the result of this study, the saturated water content of several gas mixtures were compared with the results of EzThermo [10] software. The SRK EOS in the EzThermo software was developed and regressed to predict the properties of sweet synthetic natural gas and natural gas compositions [11]. The same is also valid for the SRK EOS in ProMax. The comparison of these two software is presented in Table 2. This table indicates an excellent agreement between these two software.
Table 2. Comparison of the ProMax [6] and EzThermo [10] predicted saturated water content results at 37.8 °C (100 °F)

Conclusions
Figures 2 through 5 cover wide ranges of pressures and temperatures commonly encountered in the gas processing operation. The analysis of Figures 2 through 5 indicates that the gas relative density has minimal effect on the saturated water content of sweet natural gases. This conclusion is valid for the following ranges:
- Sweet gas relative density in the range of 0.6 to 0.8
- Temperature range of 4.4 to 149 °C (40 to 300 °F)
- Pressure range of 1724 to 13793 kPaa (250 to 2000 psia)
Additional experimental water content data are being taken and analyzed by the GPA Research Committee to update the relative density correction factor as presented in [8]. From the data that are currently available, it appears that this correction is minimal if any for gas compositions, and temperature and pressure ranges that typically occur in the oil and gas facilities. This will be confirmed once the results from the GPA Research Committee have been published.
To learn more about similar cases and how to minimize operational problems, we suggest attending our G4 (Gas Conditioning and Processing), G5 (Gas Conditioning and Processing – Special), G6 (Gas Treating and Sulfur Recovery), PF49 (Troubleshooting Oil and Gas Facilities), and PF81 (CO2 Surface Facilities) courses.
PetroSkills offers consulting expertise on this subject and many others. For more information about these services, visit our website at http://petroskills.com/consulting, or email us at consulting@PetroSkills.com.
Dr. Mahmood Moshfeghian
Reference:
- http://www.jmcampbell.com/tip-of-the-month/2014/09/lean-sweet-natural-gas-water-content-correlation/
- http://www.jmcampbell.com/tip-of-the-month/2007/11/water-sour-natural-gas-phase-behavior/
- http://www.jmcampbell.com/tip-of-the-month/2014/09/lean-sweet-natural-gas-water-content-correlation/
- http://www.jmcampbell.com/tip-of-the-month/2014/02/acid-gas-water-content/
- Soave, G., Chem. Eng. Sci., Vol. 27, pp. 1197-1203, 1972.
- ProMax 3.2, Bryan Research and Engineering, Inc., Bryan, Texas, 2014.
- Campbell, J.M., “Gas conditioning and Processing, Vol. 1: The Basic Principles”, 9th Edition, 2nd Printing, Editors Hubbard, R. and Snow–McGregor, K., Campbell Petroleum Series, Norman, Oklahoma, 2014.
- GPSA Engineering Data Book, Section 20, Volume 2, 13th Edition, Gas Processors and Suppliers Association, Tulsa, Oklahoma, 2012.
- Maddox, R.N., L.L. Lilly, M. Moshfeghian, and E. Elizondo, “Estimating Water Content of Sour Natural Gas Mixtures”, Laurence Reid Gas Conditioning Conference, Norman, OK, Mar., 1988.
- EzThermo, Moshfeghian, M. and R.N. Maddox, 2015.
- GPA Research Report RR-42, Predicting Synthetic Gas and Natural Gas Thermodynamic Properties Using a Modified Soave Redlich Kwong Equation of State, Oklahoma State University, August 1980

Hello,
Can I be registered to TOTM and recieve all updates to my work email? Many thanks!
ps. I had taken the G4 course in 2008 and used to recieve the TOTM to my previous employer’s email inbox.
Much appreciated.
Mirna
I am a huge fan of Dr. Moshfeghian’s many timely, important, and excellent engineering articles in the TOTM and I continue to recommend all engineers to closely follow these valuable and profitable tips.
However, I now find that Dr. Moshfeghian’s great work has gone through editing without the usual, required engineering checking and proofing that is due his meticulous and detailed work. I refer to the following pressure conversion errata:
1,724 kPaa = 250 psia (OK);
3,448 kPaa = 400 psia (WRONG);
6,897 kPaa = 100 psia (WRONG); and
13,790 kPaa = 2,000 psia (OK);
However, 500 psia = 3,447 kPaa; and 1,000 psia = 6,895 kPaa. Is this what was meant?
I believe this should be cleared up to uphold Dr. Moshfeghian’s prestigious work in our field.
Art:
Good catch!
In the last line of the 2nd paragraph on first page, the 400 and 100 psia should have been 500 and 1000 psia, respectively. The correction has been made.
The the pressure values/numbers on all diagrams were correct.
Many thanks for pointing out this typo.
Mahmood
Art, Thanks for catching conversion mistake. I will do my best to avoid silly mistake.
thanks for the article,
I would recommend to include also the european GERG standards (ISO 18453 and GERG 2008), you may find the procedures in softwares such as Nist Refprop (GERG 2008) and Prode Properties (both GERG 2008 and ISO 18453),
results for water contents (for those mixtures at specified conditions) are a bit different.