Water-Sweet Natural Gas Phase Behavior

In the past Tips of the Month, we discussed the phase behavior of water-free natural gas mixtures. In this tip, we will demonstrate the water-sweet natural gas phase behavior. In future tip, we will address wet sour gas.

Water is produced with oil and gas. A question that comes to mind is: “why water is important?” The presence of water may cause corrosion, freezing and hydrate formation. Hydrates can even form at warm temperatures in the presence of water. Once hydrates are formed, they are hard to remove. For design and operation of a plant it is important to know:

  1. Where water is in the process?
  2. How much water is present?
  3. What form/phase water is in at operating conditions, during start-up, during shut-down and during upsets?

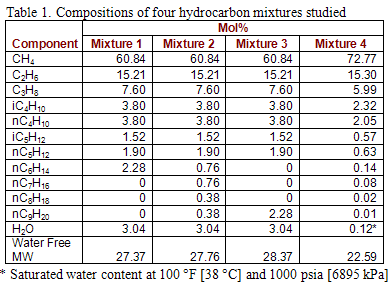
A phase envelope with hydrate and water dew point curves is an excellent tool to answer the above questions. The water content of a gas depends on the system temperature, pressure and composition of the water containing gas. There are several methods of calculating of water content. The details of these methods can be found in Chapter 6 of Volume 1 and Chapter 9 of Volume 3 of “Gas Conditioning and Processing” [1, 2]. In this work we will use Figure 6.1 of Volume 1 and the modified Soave-Redlich-Kwong (SRK EoS) reported in GPA RR-42 by Erbar et al. [3]. This version of SRK is tailor fitted for water-hydrocarbon systems. The compositions of natural gases studied in this work are shown in Table 1.

Table 1

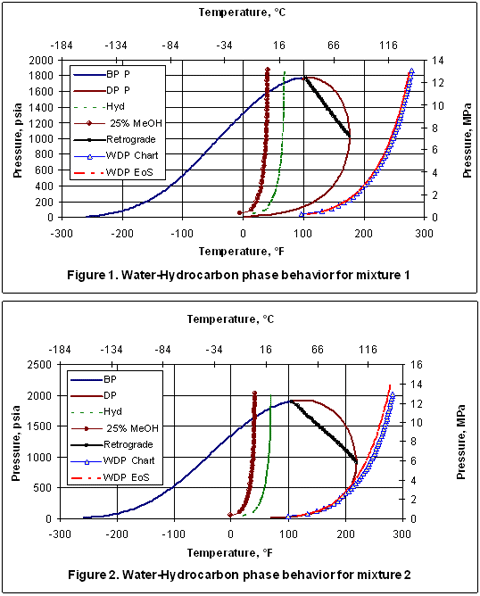
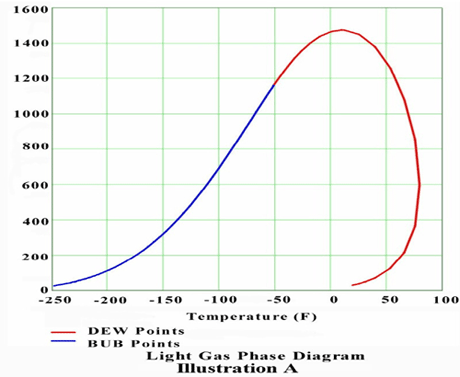
Figure 1 presents the phase behavior for mixture 1. This figure includes from right to left: the water dew point, hydrocarbon dew point, retrograde, hydrate formation, 25 weight percent methanol (MeOH) inhibited hydrate formation, and the bubble point curves, respectively. The blue-triangular-symbol water dew point curve is predicted by use of Figure 6.1 of Volume 1 and the red curve represents the water dew point predicted by rigorous calculations using the modified SRK. It is interesting to see that both methods agree quite well with each other. However, the results obtained by Figure 6.1 are somewhat more conservative. The region to the right of water dew point curve is gas phase and to the left the liquid water is present.

Graphs 1 and 2

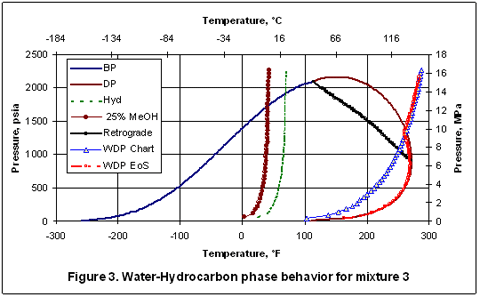
Figure 2 presents the phase behavior for mixture 2 which contains heavier compounds including nC9H20. However, the water content is the same as in mixture 1. Note the position of the water dew points did not change but, the hydrocarbon dew point curve has moved to the right, as expected, due to presence of heavier compounds. At lower pressures, the water dew point curves coincide with the hydrocarbon dew point curve. This is merely by coincidence.

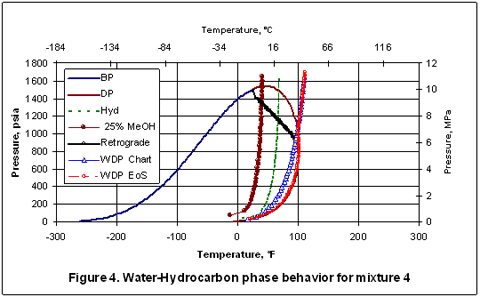
Figure 3 presents similar phase diagram for mixture 3 which is essentially the same as mixture 1 except nC6H14 has been replaced with nC9H20. Again, the hydrocarbon dew point curve shifts to the right due to presence of nC9H20.

Graph 3

It is interesting to note that the dry hydrocarbon dew points and the wet hydrocarbon dew points predicted by SRK coincide very closely with each other; the difference is practically negligible. Also note that at a specified pressure, the higher of the two dew points (hydrocarbon and water) have been calculated by the SRK EoS. So, below about 1400 psia [9653 kPa], the wet hydrocarbon dew point is predicted while for pressures above 1400 psia [9653 kPa], the water dew point (the higher one) is predicted.

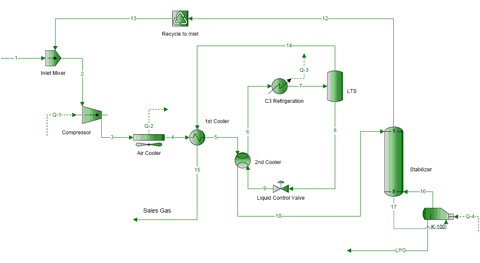
Finally, mixture 2 has been passed through a separator at 100 °F [38 °C] and 1000 psia [6895 kPa] and the resulting vapor compositions from a three-phase flash calculation based on the SRK EoS is shown in the last column of Table 1 as mixture 4. Due to the removal of free water and heavy hydrocarbons from mixture 2, the phase envelope and the water dew point curve have moved to the left, as expected. At this condition, the water content by SRK EoS is 0.0012 mole fraction equivalent of 57 lbm/MMSCF or 914 kg/106 std. m3. Figure 4 indicates that the hydrocarbon dew point and water dew point curves intersect at 100 °F [38 °C] and 1000 psia [6895 kPa] which are the conditions of the separator.

Due to the fact that hydrate formation is controlled mostly by lighter components, there are only small variations of the hydrate formation curve and its inhibition by 25 weight percent methanol in all four mixtures.

To learn more about similar cases and how to minimize operational problems, we suggest attending our G4 (Gas Conditioning and Processing) and G5 (Gas Conditioning and Processing – Special) courses.

By: Dr. Mahmood Moshfeghian

Graph 4

Reference:

  1. Campbell, J.M., “Gas conditioning and Processing, Vol 1: The Basic Principles”, 8th Edition, Edited by R.A. Hubbard, John M. Campbell & Company, Norman, USA, 2001.
  2. Maddox, R.N., “Gas conditioning and Processing, Vol 3: Computer Applications and Production/Processing Facilities”, John M. Campbell & Company, Norman, USA, 1982.
  3. Erbar, J.H., Jagota, A.K., Muthswamy, S. and Moshfeghian, M., “Predicting Synthetic Gas and Natural Gas Thermodynamic Properties Using a Modified Soave Redlich Kwong Equation of State,” Gas Processor Research Report, GPA RR-42, Tulsa, USA, 1980.

5 responses to “Water-Sweet Natural Gas Phase Behavior”

  1. I’m impressed, I must say. Rarely do I come across a blog that’s
    equally educative and entertaining, and without a doubt, you have hit the nail
    on the head. The issue is something that not enough folks are speaking intelligently about.
    Now i’m very happy I found this during my search for something relating to this.

  2. please my good people of nigerians, the blood of jesus christ which he sheard for us on the corss of calveary will wash any of us who have mistakinly drink the poisnouse table water called DEW. pls my good people try nd consus of wot u eat cos this world is full of evil nd wickedness. PLS BE ALART ALL DAY. to NAFDAC, more strenth in ur work God belss u al

  3. Discount Promotion Bitdefender Elements to Take Word When Selecting the Greatest Internet Security. Which Web Safety Has the Finest Features and Instruments?.

  4. formation referent sante et securite au travail formation referent sante
    et securite au travail acheter terbinafine formation referent sante
    et securite au travail formation referent sante et securite au travail

  5. judi bandarq says:

    Jika ingin mengetahui klasifikasi ini anda bisa lihat di kumpulan situs poker on the net rekening BRI
    atau dikumpulan situs poker online rekening BNIatau yang lain.

Consequence of Liquid Carry Over – Part 2: Fixed Heat Exchanger Area

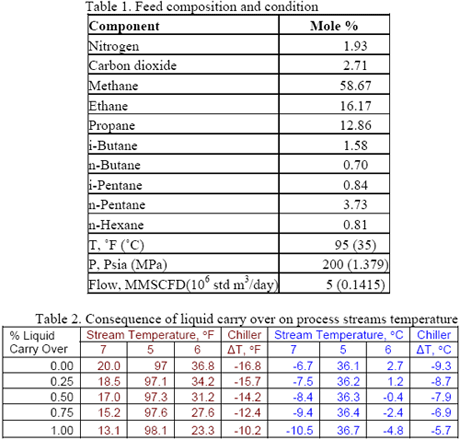
Many facility operating problems are related to improperly designed or under-sized gas-liquid separators. Due to the importance of separators, in the July Tip of the Month (TOTM), we studied the effect of liquid carry over in a simple dew point control plant. In that study, assuming variable area of the heat exchangers, we found that one percent liquid carry over can cause considerable change in compressor power requirement and heat exchanger duty. This assumption is valid if we are designing a new plant and the equipment is being sized for construction. However, for an existing plant, the heat exchanger areas are fixed. In the continuation of our previous study, we will revisit the same case study and investigate the consequence of liquid carry over but we will use the same heat exchangers (i.e. keeping UA constant; U=overall heat transfer coefficient and A=area).

Let’s consider the same process flow diagram as shown in Figure 1 for a simple gas plant. The feed composition and conditions are shown in Table 1. We have already shown the impact of liquid carry over on the “sales gas dew point” and we experienced that for even a small liquid carry over (1 %), the dew point offset was about 6°F [3.3 °C]. We will demonstrate the consequences of liquid carry over on the other equipment while maintaining the “spec dew point”.

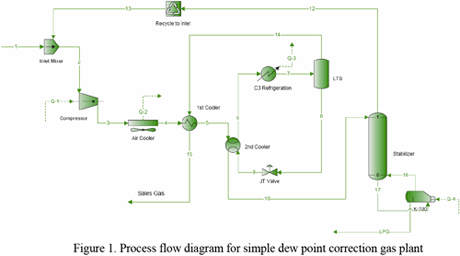
Process Flow Diagram

Figure 1. Process flow diagram for simple dew point correction gas plant

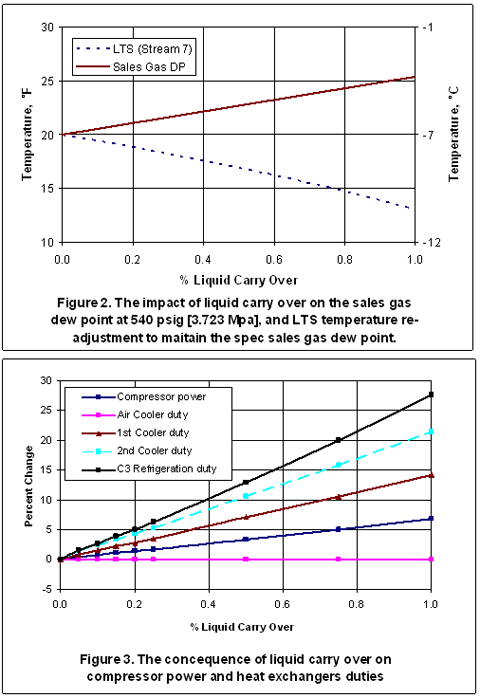
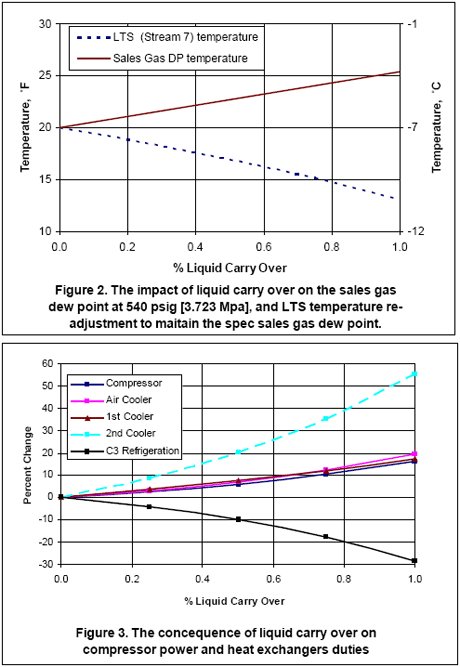
It is desired to process this feed gas to produce a sales gas with a dew point of 20°F [-6.7 °C] at 540 psig [3.723 MPa] The feed gas is mixed with recycle gas from a stabilizer, compressed and cooled to 110°F [43.3°C] and 555 psig [3.827 MPa], then cooled in the gas-gas exchanger, gas-liquid exchanger and finally in the chiller to 20°F [-6.7°C] before entering the separator at 540 psig [3.723 MPa]. In real equipment, there would be some liquid carry over. In order to show the impact of liquid carry over, in the simulation we withdraw a small portion of liquid stream from the separator and remixed it with the vapor stream.  The solid curve in Figure 2 shows how the dew point of sales gas goes off spec as a function of the liquid carry over.

In order to bring back the sales gas dew point to spec, we re-adjusted (lowered) the stream 7 temperature. The required degree of re-adjustment is shown by the dashed line in the same figure. As a consequence of re-adjusting of the stream 7 temperature, the conditions of other equipment and streams changed. Figure 3 shows the variation of compressor power and the heat exchanger duties as a function of liquid carry over. As can be seen in this figure, one percent liquid carry over can cause considerable change. For this case, the percent changes ranged from 0 to 27 percent. The changes in the reboiler duty, sales gas and LPG flow rates were negligible. Contrary to the findings of the July TOTM, here we see that the chiller duty increases as we expected.

Not included in this analysis is an examination of the affect of lowering the chiller outlet temperature on the refrigeration system.  In an existing plant, to lower the refrigerant temperature, the chiller would have to operate at a lower pressure so that the power required for the refrigerant compressor would increase. The overall effect of liquid carry over is the increase in the operating cost, as expected.

To learn more about similar cases and how to minimize operational problems such as liquid carry over, we suggest attending our G4 (Gas Conditioning and Processing) and G5 (Gas Conditioning and Processing – Special) courses.

By: Dr. Mahmood Moshfeghian

Tables 1 and 2Graphs 1 and 2

0 responses to “Consequence of Liquid Carry Over – Part 2: Fixed Heat Exchanger Area”

Vigilance in Outside Contracting

The Tip of the Month for May raised awareness of the role of process safety management (PSM) in preventing accidents. You may be aware that OSHA 29 CFR 1910.119 determines what constitutes a PSM regulated facility and other laws such as Section 304 of the Clean Air Act address PSM training for employees. These are examples of efforts to drive increased vigilance for safety in industries such as Oil and Gas, but how are we applying this vigilance to our contracting processes? How do we avoid having outside contractors represent the highest percentage of reported injuries and fatalities or be the cause of them? There are a couple of keys to being on top of contractor safety management that apply to both engineering and contracting professionals.

In many respects, contractor safety is inherently more difficult to maintain than the safety of our own employees. For one thing, multiple business cultures are involved when contractors are working on our sites. The contracting process must overcome differences in safety standards, attitudes, training and communications between all the parties. This may be a concern for a single project with multiple contractors and sub-contractors or it may result from a revolving door of unique contractors used to meet ongoing requirements for operations and maintenance activities. Vigilance in this case starts with recognition of the dynamic nature of the workforce involved.

Secondly, there can be a general tendency with contracting terms and conditions, originally designed to raise the level of awareness and vigilance for contractor safety, to simply become safety “boilerplate” included in a mountain of documents. Warning signs of this problem can occur in two ways:

  • Data collected in the contracting qualification phase is simply reviewed for completeness and then filed without proper analysis for each specific job being contracted. A contractor might be PSM approved, have provided required OSHA logs and a list of Health, Safety and Environmental (HSE) training programs and still not have dealt with a particular hazard that applies to the job in question. Who will uncover this information before the job begins?
  • Contract terms and conditions for safety become standardized (as they should), but there are little or no job-specific terms and conditions added in each contracting process (the one-size-fits-all contract syndrome). Who tells the contracting department what unique hazards are involved in each job? Does the contracting department require a job hazard analysis or pre-job meeting and safety plan when putting a contract together in order to expand the language appropriately?

Example:

According to a 2003 bulletin from the U.S. Chemical Safety Board on nitrogen asphyxiation, there had been 80 deaths and 50 injuries from asphyxiation over a period of ten years ending in 2002. Yet there have been instances since of workers and contractors not adequately warned or trained to avoid improper entry into an unsealed, confined space under a nitrogen purge.

Regardless of any safety training documentation provided by the contractor or safety language commonly found in the contract, I would want to see a clear statement that this job involves work around a vessel containing nitrogen. There then should be a formal, documented acknowledgement that these workers (by name) are trained in the hazards of nitrogen purges and oxygen-deficient atmospheres and have been instructed about client company confined space entry rules. They must know that “oxygen deprivation rapidly overcomes victims, there is no warning before being overcome, oxygen-deficient atmospheres might exist outside confined space openings and rescuers must strictly follow safe rescue procedures.” A contractor safety plan might include required steps by the client to barricade the work area and post warning signs for a particular job. There may have been hundreds of other recent contracts that had nothing to do with this type of hazard and yet the contracting process needs to be able to put it on the table in this instance. It requires the help of everyone involved to identify, communicate and document these needs.

Vigilance in contracting requires use of all the information we collect in the contracting process. For example, ISN is billed as the leader in Compliance Records Management and Reporting with more than 8,600 contractors and 100 owners using the service. As a result, most major oil companies are owner/subscribers to ISNetworld as a standard tool for HSE compliance among other things. How is the contracting function using this tool? In the interest of maintaining vigilance, is there a measure of this use?

If 100 contracts are issued each month involving outside contractor work, how many inquires are made to ISNetworld to review and verify HSE records or information? Like tracking hits on a website when new marketing campaigns are launched, there should be a user metric that correlates to new contracts being issued. If inquiries are not being made as contracts are finalized, why not?

In our PetroSkills approved course, SC-41 Contracts & Tenders Fundamentals, there is a role playing exercise that ties much of this discussion together. The scenario involves role playing as representatives of owner and contractor teams to review requirements for demolition of an old sulfur recovery plant. With the plant being out of service for 10 years and “hydrocarbon free,” there is a disagreement about the need and expense for gas tests on the lines to be removed and Nomex protective wear provided for the contract workers. How will a contract move forward?

The first indication of contracting vigilance demonstrated in the exercise is simply in having such a meeting instead of just passing contractual documents back and forth prior to the work initiation. Second it demonstrates how this type of pre-job meeting will highlight the understanding, issues and concerns of both parties while providing the means to contractually document, communicate and monitor the resulting HSE requirements going forward.

In May, Clyde Young concluded his Tip of The Month with the observation that safety culture can be defined as “the way we do things around here.” That certainly applies to working with outside contractors and should raise the question of whether constant vigilance is adequately built into the contracting process.

To learn more about roles and responsibilities in contracting processes, we suggest attending our Contracts & Tenders Fundamentals course. Other Supply Chain, Operations Management and HSE courses may be found on our website.

By: Ronn Williamson
Instructor / Consultant

1 response to “Vigilance in Outside Contracting”

  1. Hello there! I could have sworn I’ve been to this site before but after checking through some of the post I realized it’s new to me. Nonetheless, I’m definitely delighted I found it and I’ll be bookmarking and checking back frequently!

Consequence of Liquid Carry Over in a Simple Dew Point Control Plant

Problems in meeting sales-gas dew point specifications are not unusual. A facility engineer often suspects separator carryover when trouble-shooting such a plant. Proper sizing of equipment for vapor-liquid separation is essential to almost all processes. The fundamentals of a simple separator design may be extended to several other processes such as fractionation towers, two-phase flow, slug catcher design etc. Many facility operating problems are related to improperly designed or under-sized gas-liquid separators.

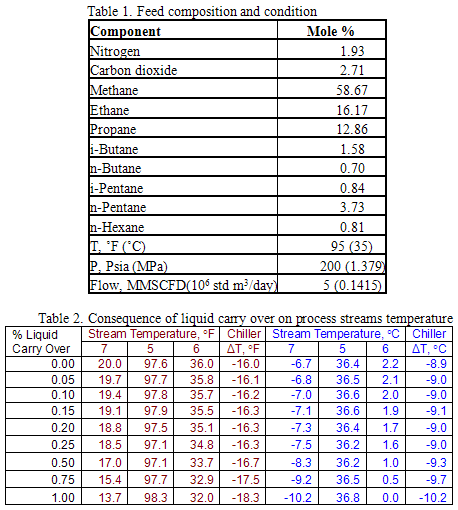
Let’s consider the process flow diagram shown in Figure 1 for a simple gas plant. The feed composition and conditions are shown in Table 1. In one of our past Tip of the Months (TOTM) we demonstrated the impact of liquid carry over on the “sales gas dew point” and we experienced that for even a small liquid carry over (1 %), the dew point offset was about 6°F [3.3 °C]. In this Tip of the Month, we will demonstrate the consequences of liquid carry over on the other equipment while maintaining the “spec dew point”.

Process Flow Diagram

It is desired to process this feed gas to produce a sales gas with a dew point of 20 °F (-6.7 °C) at 540 psig (3.723 MPa) The feed gas is mixed with recycle gas from a stabilizer, compressed and cooled to 110°F (43.3°C) and 555 psig (3.827 MPa), then cooled in the gas-gas exchanger, gas-liquid exchanger and finally in the chiller to 20°F (-6.7°C) before entering the separator at 540 psig (3.723 MPa). In real equipment, there would be some liquid carry over. The commercial simulators will assume a perfect gas-liquid separation unless the users manually force some carryover. In order to show the impact of liquid carry over, in simulation we withdraw a small portion of liquid stream from separator and remixed it with the vapor stream. The solid curve in Figure 2 shows how the dew point of sales gas goes off spec as a function of the liquid carry over.

In order to bring back the sales gas dew point to spec, we re-adjusted (lowered) the stream 7 temperature. The required degree of re-adjustment is shown by the dashed line in the same figure. As a consequence of re-adjusting of the stream 7 temperature, the conditions of other equipment and streams changed. Figure 3 shows the variation of compressor power and the heat exchanger duties as a function of liquid carry over. As can be seen in this figure, a-one percent liquid carry over can cause considerable change. For this case, the percent changes ranged from 15 to 55 percent. The changes in the reboiler duty, sales gas and LPG flow rates were negligible. Please note that we assumed variable area of the heat exchangers. If this analysis is done prior to building a new plant, the largest heat exchangers needed could be purchased. However, in an existing plant the heat exchanger areas are fixed. An interesting “surprise” can be seen in Figure 3, the duty of chiller went down as the liquid carryover increased. This is due to the fact that the enthalpy of stream 6 decreases more than the required change in the enthalpy (temperature) of the cold separator. Therefore the process gas duty across the chiller decreases as the liquid carry over increases (see Table 2). In other words, liquid carry-over from the LTS makes the gas/gas heat exchanger into a “chiller” as the liquids vaporizes in that heat exchanger, lowering actual chiller duty, but still increasing the sales gas dewpoint temperature.

Not included in this analysis is an examination of the affect of lowering the chiller outlet temperature on the refrigeration system. In an existing plant, to lower the refrigerant temperature, the chiller would have to operate at a lower pressure so that the power required for the refrigerant compressor would increase. The overall effect of liquid carry over is the increase in the operating cost, as expected.

To learn more about similar cases and how to minimize operational problems such as liquid carry over, we suggest attending our G4 (Gas Conditioning and Processing) and G5 (Gas Conditioning and Processing – Special) courses.

By: Dr. Mahmood Moshfeghian

Tables 1 and 2 

Graphs 1 and 2

2 responses to “Consequence of Liquid Carry Over in a Simple Dew Point Control Plant”

  1. You made some decent points there. I looked online for the problem and discovered most people will go along with together with your site.

  2. Angeles Ratia says:

    Good afternoon Dr. First of all we hope is well . We are students at the University of East ( Anzoategui – Venezuela ) , to which we referred her article as a subject for a monograph. The overall objective given us is ” Establish control criteria for reducing the impact caused by the fluid drag on the dew point of the gas sale ” . Therefore, we turn to you in order to get more information and help on your part , if possible . We require the following information: description of the process ( more detailed ) data input and output currents in each team rules considered and country where the study was applied , and whether it considers any other pertinent information would appreciate . Thank you very much!

Why do I care about phase diagrams?

In facilities operations the understanding of where the process is on a phase diagram can often help the engineer and operator avoid extremely embarrassing design and operating mistakes. The oil and gas industry is full of many “war stories” about “phase diagram disasters.” Most instances are never related back to the phase diagram misunderstanding. In one well-documented but poorly published case a “dry gas” pipeline that was pigged flooded miles of sandy beach. In another case thousands of kilowatts of compression power were installed to maintain the pressure of a reservoir above the dew point when in fact the reservoir was at a temperature above the cricondentherm. In many cases equipment manufacturers and purchasers of gas have specifications of “superheat” or dew point that have not been met and led to upset customers and/or millions of dollars of lawsuits.

One of the first issues to be resolved by a facilities engineer working in a gas plant or gas production facility is where is the process operating with respect to the phase diagram. A general knowledge, if not a detailed knowledge, will allow the design engineer and the facilities operator to make intelligent decisions that have significant impact on the profitability of a gas production facility.

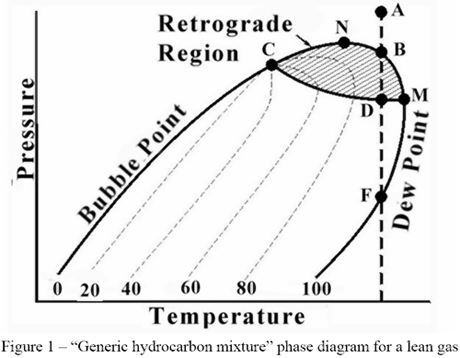
The following figure is a “generic hydrocarbon mixture” phase diagram for a lean gas. The area to the left of the Bubble Point line is the sub-cooled liquid region.

Graph 1

The area to the right of the Dew Point line is the super-heated gas region. Between these two lines the mixture is two-phase. Other areas of interest are the retrograde region and the supercritical region. Each of these regions provides advantages and disadvantages for operations.

This month we will start to define the points of interest so that we may choose proper operating points for various types of processes. The first point to define is the cricondentherm. The definition of this point is the highest temperature at which twophases (liquid and vapor for most processes) can coexist. In Figure 1, this is point M. Point M has considerable theoretical and practical importance. For example, if the cricondentherm for a sales gas (point M) is 0 ºC (32 ºF) cooling the gas to 4 ºC (40 ºF) at any pressure will not result in condensation of liquids. This type of operation is typically the type used for cross-country transportation of gas in pipelines. Operation with this type of system will not require “slug catchers” at the end of the pipeline and will significantly decrease pressure drop in the pipeline.

If the gas were processed in a cold separator such that point B (a dew point) was 0 ºC (32 ºF) problems could occur in the same conditions as the pipeline mentioned above. If the pressure of the pipeline was between the pressure of point B and F and the pipeline cooled to 4 ºC (40 ºF) there could be significant quantities of liquid in the pipeline. If the operations people were not familiar with the phase diagram they might increase the operating pressure of the cold separator and still keep the temperature at 0 ºC (32 ºF). This action would result in increased liquids in the pipeline, not decreased. However, if the cold separator was operated at the pressure of point M, at a temperature of 0 ºC (32 ºF), in theory there would be no liquids in the pipeline again. (More about the difference between theory and practice in future tips).

Graph 2

To learn more about similar cases and how to minimize operational problems, we suggest attending our G4 (Gas Conditioning and Processing) and G5 (Gas Conditioning and Processing – Special) courses.

Dr. Larry L. Lilly

6 responses to “Why do I care about phase diagrams?”

  1. Fahad says:

    Thank you for discussing very important topic. I just want to point out there are some minor discrepancies:
    1. paragraph 4, line 4: ” For example, if the cricondentherm for a sales gas (point M) is 0 ºC (32 ºF) cooling the gas to 4 ºC (40 ºF) at any pressure will not result in condensation of liquids”. I am sure you mean heating the gas rather than cooling.
    2. paragraph 5, line 1: “If the gas were processed in a cold separator such that point B (a dew point) was 0 ºC (32 ºF) problems could occur in the same conditions as the pipeline mentioned above. If the pressure of the pipeline was between the pressure of point B and F and the pipeline cooled to 4 ºC (40 ºF) there could be significant quantities of liquid in the pipeline” Inconsistent with the previous example and the values.

    Thank you

  2. Kathy Wilson says:

    I have enthalpy values for various hydrocarbon components on the US Governments NIST site in their Web Book and have compared these to the pressure enthalpy graphs found in the GPSA binder. They are significantly different. In some cases they were out by 100%. The critical point was the same for both and the delta H between the Vapour and Liquid curves were the same on the few I compared. The isobars, the isotherms and the specific volumes were wildly different.When I enquired about this I was told it was because of a “Reference Point”. This is where the explanation ended. If the Critical Point, normal boiling point and delta are fixed reference points, how can the other data points be so out of wack. If I have inlet gas and need to remove heat to pull out LPG, NIST says I need to strip out twice the heat to get to the vapour curve that the GPSA graphs show. Any suggestions on haow to get comparable volumes. Using Hysis is not an option I have.

  3. It’s just a test.

  4. Patrick Osborne says:

    the author is correct, cricondentherm is a typical specification for pipelines, with temperatures ABOVE cricoT you are sure that no condensation is possible,
    see

    http://www.prode.com/en/phaseenvelope.htm

    you may download the free version and see yourself 🙂

  5. 30超えにもなってくると、肌のこめかみやおでこにシミやくすみ、そばかすが気になってきますよね。そんななやみに効果的なのが、シミ漂白石鹸「エンジェルプレミアマジックソープ」なんです。
    混合された美白成分の効果で、洗うだけでシミやくすみが取れちゃうんだとか!
    絶対一度は使ってみたいですね!

  6. Aboelnasr Mahran says:

    please,
    what is the difference between hydrocarbon dew point and cricondentherm?

Vigilance With a Healthy Dose of Fear

In this Tip of the Month we will focus on HSE (Health, Safety, and Environment) issues, specifically on “Process Safety” in the Oil and Gas Industry.

Anyone working in the oil and gas industry during the last several years has probably been affected by or at the very least, heard about the “big crew change”. Whether you are in the large group of people waiting for retirement age, or a fairly new hire looking forward to a bright career, you are part of this change. Change inevitably brings challenge. And one of the big challenges is how do we transfer the knowledge and experiences from that first, experienced group to the eager but inexperienced group?

Meeting this challenge is vital in the area of process safety. While there are many technical engineering tasks that must be performed to ensure process safety, management of the system requires that all personnel involved in process safety understand their role within the process safety management (PSM) system. Performing a specified role within a system is a skill that can be learned and does not necessarily come naturally to people.

Some companies have established PSM systems to meet regulatory requirements in the countries in which they operate. There are some differences in the regulatory requirements but in general PSM systems contain the major elements found in the American Petroleum Institute’s (API) Recommended Practice 750, “Management of Process Hazards.” RP 750 contains these elements of a PSM system, Process Safety Information (PSI); Process Hazard Analysis (PHA); Management of Change (MOC); Operating Procedures; Safe Work Practices; Training; Quality and Mechanical Integrity; Pre-startup Safety Review (PSSR); Emergency Response and Control; Incident Investigation; and Audits. In addition to API, more guidance can be found through the American Institute of Chemical Engineers’ (AIChE) Center for Chemical Process Safety (CCPS). RP 750 is a system to manage process safety, the policies and procedures established for this are similar to any systems approach to a project.

Understanding and managing the interrelationship among all these elements is generally too much for every person in an organization, so individual departments are sometimes tasked with this. But, every person in the organization plays a role in the overall management system.

As the workforce changes, experience leaves and inexperience replaces, it becomes difficult at times to perform the work required to manage the business. Personnel sometimes become so focused on individual jobs that they sometimes forget that the things they do have an impact on the system. It is therefore important to have a system in place that directs actions and ensures that all issues are addressed before changes are made that affect the processes, which produce the products being delivered.

“Preventing process accidents requires vigilance. The passing of time without a process accident is not necessarily an indication that all is well and may contribute to a dangerous and growing sense of complacency. When people lose an appreciation of how their safety systems were intended to work, safety systems and controls can deteriorate, lessons can be forgotten, and hazards and deviations from safe operating procedures can be accepted. Workers and supervisors can increasingly rely on how things were done before, rather than rely on sound engineering principles and other controls. People can forget to be afraid.” This statement from the report of The B.P. U.S. Refineries Independent Safety Review Panel, also known as the Baker Panel, provides the tip of the month: Vigilance with a healthy dose of fear.

All personnel in the organization need to be able to discuss process safety issues. In order to do this effectively, they should keep up to date on incidents, new methods and all other issues associated with process safety in the oil and gas industry. The following table provides sources of information available on the Internet that may be helpful:

Organization Web site
U.S. Chemical Safety Board www.csb.gov
U.S. Occupational Safety and Health Administration www.osha.gov
International Association of Oil & Gas producers (OGP) www.ogp.org.uk
Center for Chemical Process Safety www.aiche.org/CCPS
American Petroleum Institute EHS www.api.org/ehs/health/
Health and Safety Commission in the UK www.hse.gov.uk/
Work Safe BC in Canada www.worksafebc.com

This is a small sampling of the information available through the Internet to guide personnel in the philosophies, tools and techniques available for safety management systems. To stay abreast of recent events in the field, consider creating news alerts for the following: refinery fire, plant explosion, toxic release, industrial accident, workplace injury, workplace fatality. While you may receive information that is not specifically relevant to the oil and gas industry, some alerts may present a topic that is being addressed within your organization.

“The U.K. Health and Safety Executive describes safety culture as “the product of individual and group values, attitudes, competencies and patterns of behaviour that determine the commitment to, and the style and proficiency of, an organization’s health and safety programs” (HSE, 2002). The CCPS cites a similar definition of process safety culture as the “combination of group values and behaviors that determines the manner in which process safety is managed” (CCPS, 2007, citing Jones, 2001). Well-known safety culture authors James Reason and Andrew Hopkins suggest that safety culture is defined by collective practices, arguing that this is a more useful definition because it suggests a practical way to create cultural change. More succinctly, safely culture can be defined as “the way we do things around here” (CCPS, 2007; Hopkins, 2005). An organization’s safety culture can be influenced by management changes, historical events, and economic pressures.”1

Whether you are one of those older, more experienced people or one of those inexperienced but eager newly hired people, consider how you will work within and influence the safety culture of your organization.

To learn more about process safety and HSE management systems, enroll in JMC/PetroSkills Facilities HSE courses:HS 44 and HS 45. Other HSE courses are available to develop HSE related competencies and may be found on our web site.

By: Clyde Young
Instructor/Consultant

References:

1 U.S. Chemical Safety and Hazard Investigation Board, final report of BP Texas City explosion, March 23, 2005.


3 responses to “Vigilance With a Healthy Dose of Fear”

  1. […] The May, 2007 Tip of the Month, mentioned a statement from the Baker Panel report of the Texas City incident.  “……People can forget to be afraid.”  The Tip of the Month now is an accident prevention pillar from the Center for Chemical Process Safety’s (CCPS) Risk Based Process Safety system.  Learn from experience. […]

  2. Bon ba cet article va aller sur mon blog perso

  3. Ces post sont réellement plaisants

  4. Tiens je vais еn parler sur mon site web personnel

MEG Dehydration Ability in MEG Injection Plant

In order to continue the last tip of the month’s discussion on MEG injection plant, in this “Tip of the Month”, we will focus on two more questions:

  1. Does MEG have any dehydration ability at the three phase cold separator condition of a typical mechanical refrigeration plant?
  2. What is the dehydration ability of MEG if the mechanical refrigeration in a typical MEG injection plant goes out of service?

As described in the last tip of the month, a typical mechanical refrigeration process is used for hydrocarbon dew point control and moderate NGL recovery that uses MEG injection to prevent hydrate formation. Warm inlet gas is cross-exchanged with the cold dry sales gas and then flows to the gas chiller. To prevent hydrates from forming, MEG is injected in the tubes at the warm end of both exchangers. The temperature of the chiller is adjusted to condense liquids from the feed gas. The cold gas exiting the chiller together with the rich MEG solution and condensed hydrocarbons enters the cold three-phase separator. The rich MEG is sent to the regeneration section of the unit where the water is removed. The resulting lean MEG is sent back to the process. In short, two things are taking place: temperature reduction of the process gas to condense both water and hydrocarbons; and, MEG injection and subsequent regeneration to prevent hydrates from forming. In this scheme, the sales gas exiting the gas-to-gas exchanger has a water and hydrocarbon dew point determined by the operating temperature of the cold separator. The key point to remember here is that the water is being removed from the gas by low temperature condensation. The purpose of the injected MEG is not to “dehydrate” the gas but to prevent formation of hydrates. For more detail, refer to chapters 6 and 16 of Gas Conditioning and Processing, Volumes 1 and 2, [1, 2] respectively.

Question 1: Does MEG have any dehydration ability at the three phase cold separator condition of a typical mechanical refrigeration plant?

In order to answer this question, first we determine the water dew point temperature without any MEG injection and compare the results with the case of 80 weight percent lean MEG injection. Let’s assume a typical natural gas, cold separator pressure of 40 bara and -20°C [580 psia & -4°F] with 10 weight dilution (i.e. rich MEG concentration of 70 weight %). By performing computer simulation using ProMax [3], the water dew point temperature:

  • without MEG injection is -22.7°C (-8.7°F) corresponding to water content of 30.72 kg/106 std m3 [1.94 lbm/MMSCF]
  • with MEG injection is -29.6°C (-21.2°F) corresponding to water content of 17.6 kg/106 std m3 (1.11 lbm/MMSCF)

Therefore, the water dew point temperature depression is 6.9°C (12.4°F). Similarly, a water dewpoint temperature depression of 7.8°C [14°F] was obtained for the case of 5 weight percent MEG dilution (i.e. rich MEG concentration of 75 weight %). These results indicate that even at low temperature, in addition to the hydrate inhibition effect, MEG has the ability to do partial dehydration. It should be noted that for this gas the hydrate formation temperature at 40 bara [580 psia] is 14.9°C [58.7°F].

Question 2: What is the dehydration ability of MEG if the mechanical refrigeration in a typical MEG injection plant unexpectedly goes out of service?

Let’s assume the same gas as in question 1 is passing through a mechanical refrigeration system with the same chiller temperature of -20°C [-4°F]. Let’s also assume that due to the break down of mechanical refrigeration system (lack of chilling) the cold separator temperature reaches 21.1°C [70°F]. Again, we used ProMax to perform the simulations and the calculated results are plotted in Figures 1 (A&B) and 2 (A&B). Figure 1 (A&B) presents the effect of lean MEG circulation rate on water dew point temperature and water content. Figure 2 (A&B) indicates that for a 10 weight % dilution, about 4350 kg MEG solution per 106 std m3 [270 lbm MEG solution per MMSCF] of gas is required. Figure 2 (A&B) also indicates that for this amount of dilution, the water dew point temperature drops from 21.1°C [70°F] to about 12.2°C [54°F] and the corresponding water content drops from 567 to 325 kg/106 std m3 [35 to 21 lbm/MMSCF]. Again, it can be seen that the MEG can dehydrate natural gas partially at higher temperature. It is also interesting to see from Figures 1 and 2 that further increase in lean MEG solution circulation rate, beyond 4350 kg/106 std m3 [270 lbm/MMSCF], does not reduce the water dewpoint temperature considerably and; therefore, it justifies the rule of thumb for 10 weight % dilution.

For more information about dehydration and hydrate inhibition, the reader should refer to JMC books and enroll in our G4 (Gas Conditioning and Processing) and G5 (Gas Conditioning and Processing – Special) courses.

By Dr. Mahmood Moshfeghian

References:

  1. Campbell, J. M. “Gas conditioning and processing, Volume 1: Basic Principles,” 8th Ed., John M. Campbell and Company, Norman, Oklahoma, USA, 2001.
  2. Campbell, J. M. “Gas conditioning and processing, Volume 2: The Equipment Modules,” 8th Ed., John M. Campbell and Company, Norman, Oklahoma, USA, 2000.
  3. ProMax, version 1.2, Bryan Research & Engineering Inc, Bryan, Texas, 2005.

Figure 1AFigure 1BFigure 2AFigure 2B

2 responses to “MEG Dehydration Ability in MEG Injection Plant”

  1. Shyda Rao says:

    Dear Sir,
    Please clarify my doubts.
    (1) Whether the natural gas velocity shows any impact on MEG dehydation?
    (2) Whether the injection nozzel up stream pressure has any effect on MEG mixing with natural gas/condensate?

  2. deco ballon says:

    This is a topic which is close to my heart…
    Take care! Exactly where are yor contact details though?

    my website deco ballon

MEG Injection vs. TEG Dehydration

In this “Tip of the Month”, we will focus on the question of: Which technology should you choose? The answer, of course, is “It depends.” It depends on what you are trying to accomplish, the constraints imposed on your system and the relative economics.

A Rule of Thumb is “Use MEG injection if you have to cool the gas for NGL recovery anyway.” Like all Rules of Thumb, there are exceptions. But let’s explore the basics of each technology.

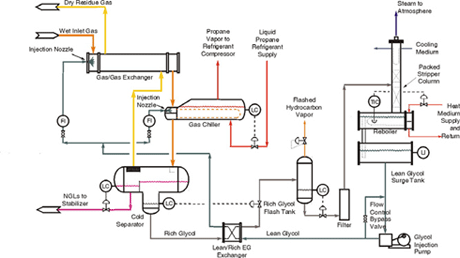
Let’s begin by defining our terms. See Figure 1 for a typical mechanical refrigeration process used for hydrocarbon dew point control and moderate NGL recovery that uses MEG injection to prevent hydrate formation. Warm inlet gas is cross-exchanged with the cold dry sales gas and then flows to the gas chiller. To prevent hydrates from forming, MEG is injected in the tubes at the warm end of both exchangers. The temperature of the chiller is adjusted to condense liquids from the feed gas. The cold gas exiting the chiller together with the rich MEG solution and condensed hydrocarbons enters the cold three-phase separator. The rich MEG is sent to the regeneration section of the unit where the water is removed. The resulting lean MEG is sent back to the process.

Process Flow Diagram

Copyright © 2007 John M. Campbell and Company

Figure 1. Typical mechanical refrigeration plant with glycol injection system [1]

In this flow diagram, two things are taking place: temperature reduction of the process gas to condense both water and hydrocarbons; and, MEG injection and subsequent regeneration to prevent hydrates from forming. Inspection of Figure 1 reveals the majority of the equipment, including the refrigeration compressors, etc. which are not shown, is employed to reduce the temperature. Besides mechanical refrigeration, other options to achieve the required gas cooling include JT – valve expansion or use of a turboexpander. For either of these options, the MEG injection and regeneration portion of this plant is minor by comparison.

In this scheme, the sales gas exiting the gas-to-gas exchanger has a water and hydrocarbon dew point determined by the operating temperature of the cold separator. The CAPEX of this system is essentially driven by the gas cooling equipment, including the refrigeration system. The key point to remember here is that the water is being removed from the gas by low temperature condensation. The purpose of the injected MEG is not to “dehydrate” the gas but to prevent formation of hydrates. At the MEG concentrations normally used in these systems, approximately 80 – 85 wt%, the MEG absorbs only a small amount of water vapor from the gas.

Let’s now look at a typical circulating TEG system. See Figure 2. The same rich, water saturated natural gas stream flows to a properly sized inlet separator to remove liquids. The gas then enters a glycol contactor equipped with either structured packing or bubble cap trays. As the gas rises, the water is removed by the falling TEG. The concentration of the lean glycol entering the top of the contactor is the main variable that determines the water dew point specification that can be made. The rich glycol that leaves the glycol contactor is sent to a flash drum and then to a regeneration section. The lean glycol leaving the regenerator is then returned to the contacting tower.

In this system, we are only making water dew point specification gas. The NGL content/hydrocarbon dew point of the sales gas is the same as that of the feed gas. Circulating TEG systems are therefore used only for dehydration. A significant cost item for the circulating TEG system is the high pressure contacting tower.

Now let’s explore how we can compare and contrast these two technologies.

If your objective is to make only pipeline water specification gas, you will most likely choose a circulating TEG system. This is intuitively obvious from a comparison of the two flow diagrams cited above. Assume, for example, that you want to dehydrate a lean natural gas stream that is water saturated at 70 bar and 40°C. A quick comparison of Figures 1 and 2 shows that there is much more equipment associated with chilling the feed gas (Figure 1 + the refrigeration compressors, etc. that are not shown) then there is with a circulating TEG system (Figure 2). Hence, for dehydration only to pipeline water specifications, a circulating TEG system will almost always be selected.

On the other hand, if your objective is to recover hydrocarbons and remove water simultaneously, then a low – temperature process with MEG injection may be the best choice. Assume you have a rich natural gas stream that is water saturated at 70 bar and 40°C. Assume a mechanical refrigeration process is selected for hydrocarbon liquids recovery with a cold temperature of -35°C. We have two options to consider: we can dehydrate the gas with a circulating TEG system to a water dew point of -35°C and then send the dehydrated gas to an LTS plant consisting of a gas-to-gas exchanger, chiller, refrigeration system, etc., but with no MEG injection/regeneration system; or, we can send the feed gas directly to the LTS plant which has an MEG injection system retrofitted to prevent hydrates from forming.

Figure 2

Copyright © 2007 John M. Campbell and Company

Figure 2. Basic glycol dehydration unit [2]

Since the underlying equipment required to recover NGL’s is the same in both options, the cost comparison is essentially between the circulating TEG system and the MEG injection system. The TEG system will use less circulating rates then the MEG system, but will likely have a higher regeneration duty. Achieving the large dew point depression of 75°C with a circulating TEG system will be challenge and will add to the system cost. The key difference, however, is the circulating TEG system requires a high pressure contactor while the MEG injection system does not. In this situation, the most likely choice will be to go with the MEG Injection system.

For more information about dehydration and hydrate inhibition, the reader should refer to JMC books and enroll in our G4 (Gas Conditioning and Processing) and G5 (Gas Conditioning and Processing – Special) courses.

By Harvey M. Malino and Mark Bothamley

References:

  1. Campbell, J. M. “Gas conditioning and processing, Volume 1: Basic Principles,” 8th Ed., John M. Campbell and Company, Norman, Oklahoma, USA, 2001.
  2. Campbell, J. M. “Gas conditioning and processing, Volume 2: The Equipment Modules,” 8th Ed., John M. Campbell and Company, Norman, Oklahoma, USA, 2000.

10 responses to “MEG Injection vs. TEG Dehydration”

  1. PABLO ZUÑIGA says:

    Estimados señores, quisiera por favor me puedan informar sobre la diferencia de deshidratacion con MEG y con TEG

  2. Arvind says:

    First time I visited this site and proved to be very useful

  3. Dave Campbell says:

    Any discussion on excessive chloride levels in a EG system. How agressive is corrosion when chlorides exceed 5000mg/l??

  4. ALIREZA says:

    Dear Sir,
    Please let me know is there any reference for using TEG for drying thegas pipeline.
    Exactly I want to know how much glycol i should use for each km and related to Diameter for Drying?
    Best Regards,
    A.SAMIMI

  5. June says:

    You will get the most effective rates by purchasing from third party retailers.
    Nonetheless it was the soundtrack that made game history.
    Fitocracy is free and available on Android and iPhone.

    Here is my blog; pc video games (June)

  6. Because the admin of this web page is working, no hesitation very quickly it will be
    well-known, due to its quality contents.

  7. It’s the best time to make some plans for the future and it is time to be happy.
    I have read this publish and if I may I
    want to suggest you few interesting things or
    advice. Perhaps you can write subsequent articles relating to this article.
    I wish to read even more issues approximately it!

    Feel free to surf to my homepage; tome 7 : Rencontres pdf

  8. William says:

    Theresa, thank you! I suggest you to stick the roof, not to sew! I just exlneipad to the girls that it’s very difficult to work with the needle when you fix the roof and it doesn’t look nice!. I used UHU Universal glue.

  9. Henry Pizzo says:

    Thank you for perhaps the most level headed thing I have read today. Thanks for the info, super helpful. I’ve found PDFfiller – online service for forms filling. It’s pretty easy to use and pretty cheap. You can find fillable a form here

  10. Parabéns pelas edificantes e abençoadas postagens! Aproveito para agradecer por todos os seus comentários na minha página. Voçê será sempre muito bem vindo!A paz do Senhor Jesus!

Friction Pressure Drop Calculation

Introduction

Engineers are frequently asked to calculate the fluid pressure drop in a piping system. Many software programs are available for solving complicated hydraulic problems; however’ they can be complex and difficult to use. In addition, there are many tables or shortcut methods that give adequate answers but they usually apply to predefined conditions which are sometimes misleading or less accurate. This “Tip of the Month” discusses a method of calculating friction pressure losses for liquid lines. A spreadsheet is presented that gives friction losses based on this method.

Background Information

Equation 1 is known as the Darcy-Weisbach (sometimes called the Darcy) equation and has been used by engineers for over 100 years to calculate fluid flow pressure loss in pipe. This equation is derived by dimensional analysis and relates the various parameters that contribute to the friction loss. A correction factor, called the Moody friction factor, is included which compensate theoretical results with the experimental results.

Equation 1

Where:

hL = Head loss due to friction, m [ft]
f = Moody friction factor
L = Pipe length, m [ft]
V = Velocity, m/s [ft/sec]
g = Gravitational acceleration, 9.81 m/sec2 [32.2 ft/sec2]
D = Inside diameter, m [ft]

The task of determining the friction factor can be difficult due to the many variables that influence flow behavior. For example, the friction factor is significantly different if the fluid flow exhibits Newtonian or non-Newtonian behavior, or if the flow is laminar or turbulent. Other variables that influence the friction factor are properties of the pipe represented by absolute roughness and inside diameter, and fluid parameters such as flow rate, viscosity and density.

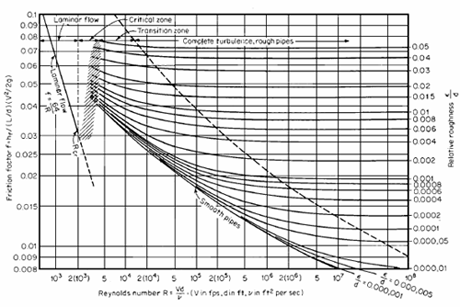
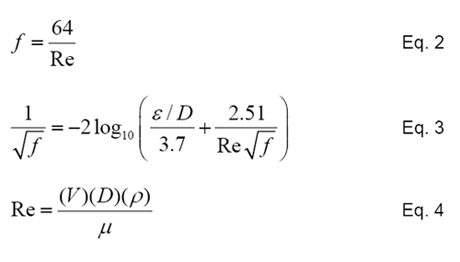
The Moody diagram given in Figure 1 is a classical representation of the fluid behavior of Newtonian fluids and is used throughout industry to predict fluid flow losses. It graphically represents the various factors used to determine the friction factor. For example, fluids with a Reynolds number of 2000 and less, the flow behavior is considered a stable laminar fluid, and the friction factor is only dependent on the Reynolds number. The friction factor for the Laminar Zone is represented by Equation 2. Fluids with a Reynolds number between 2000 and 4000 are considered unstable and can exhibit either laminar or turbulent behavior. This region commonly referred to as the Critical Zone, and the friction factor can be difficult to accurately predict. Judgment should be used if accurate predictions of fluid loss are required in this region. Either Equation 2 or 3 are commonly used in the Critical Zone. Beyond 4000, the fluid is considered turbulent and the friction factor is dependent on the Reynolds number and relative roughness. For Reynolds numbers beyond 4000, the Moody diagram identifies two regions, Transition Zone and Completely Turbulent Zone. The friction factor represented in this region is given by Equation 3.

Graph 1

Figure 1. Moody Friction Factor Diagram

Equations

Where:

Re = Reynolds Number
V = Fluid velocity, m/s [ft/sec]
D = Inside diameter, m [ft]
e = absolute pipe roughness, m [ft]
? = Fluid density, kg/m3 [lbm/ft3]
µ = Fluid viscosity, kg/(m-s) [lbm/(ft-sec)]

The Method

The Colebrook formula, Equation 3, is used throughout industry and accurately represents the Transition and Turbulent flow regions of the Moody Diagram. However, this implicit equation is difficult to solve by manual methods. Typically an iterative method is used to solve the Colebrook equation. One method of solving this equation is with numerical analysis technique called Newton-Raphson’s1 Method. This successive approximation approach is represented by Equation 5, and involves 1) the Colebrook formula, 2) the first derivative of the Colebrook formula and 3) an initial guess. Since the Colebrook formula is a convergent equation, the solution is usually determined with less than four iterations.

Equation 5

Where:

fn = nth iteration friction factor
fn+1 = (n+1)th iteration friction factor
g(fn) = Colebrook equation
g'(fn) = First derivative of Colebrook equation

A macro that solves the Colebrook formula is given in this spreadsheet. It is easily adapted to programmable calculators. The iterative method assumes that the following input variables are available:

Pipe inside diameter – mm [in]
Pipe length – m [ft]
Absolute roughness – m [ft]
Absolute viscosity – cP
Fluid relative density
Fluid flowrate – m3/h [gpm]

Example Problem

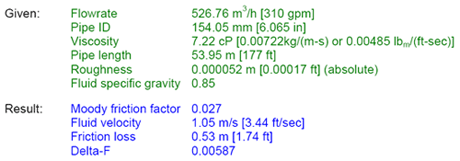
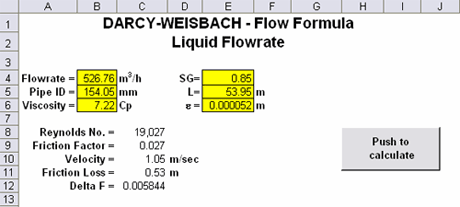
The macro begins with inputting the variables needed to solve for the Moody friction factor. Next, the macro determines the Reynolds Number. If the Reynolds value is below 2000 the flow is considered laminar and a simplified friction formula shown in Equation 2 is used. Above 2000 the flow is considered turbulent and the Colebrook formula is used. Finally, the Moody friction factor is determined and combined with the Darcy formula, Equation 1, to determine the fluid friction losses.

Results

Numerous results were checked against values given in “Cameron Hydraulic Data Book”2 and found to vary by less than one percent. A term called “Delta-F” is also given in the spreadsheet which gives an indication of the variance in the Colebrook equation and the calculated value. Values of Delta-F less then 0.05 indicates an accuracy of three or more decimal places.

Alternate Method:

An alternate method of determining the friction factor is given by Chen3. His method of calculating the friction factor is explicit and does not require iterations to solve. This method has been by studied by Gregory and Fogarasi4, and found to give satisfactory values compared to the Colebrook equation. For those interested in this alternate approach, see Equation 6.

Equations 6 and 7

Where:

f = Fanning friction factor (1/4 of Moody friction factor)
D = Inside diameter, m [ft]
e = absolute pipe roughness, m [ft]
Re = Reynolds Number

To learn more about friction factor and its impact on piping and pipeline calculation, design and surveillance, refer to JMC books and enroll in our ME41PL4PL61, and G4 courses.

By: Joe Honeywell
Instructor & Consultant

References:

  1. “Elementary Numerical Analysis”, by S. D. Conte, McGraw-Hill Book Company, 1965, pp 30
  2. “Cameron Hydraulic Data Book”, by Ingersoll-Rand Company, Woodcliff, N. J., 15 ed., pp 3-49 to 3-85
  3. Chen, N.H., An Explicit Equation for Friction Factor in Pipe, Ind. Eng. Chem. Fund., 18, 296,1979
  4. Gregory, G.A. and Fogarasi, F., Alternate to Standard Friction Factor Equation, Oil & Gas Jour. Apr. 1 1985, pp 127.

Excel Program Input and Output

ResultsResults

33 responses to “Friction Pressure Drop Calculation”

  1. Aranzazu Camacho says:

    How can I get the spreadsheet?

  2. Roberto Abarilla says:

    Hello, I also want to know, how could I get a spreadsheet? Thanks very much!

  3. Antonio Francisco says:

    I need the spreadsheet for quick calculation

  4. Martin Schmid says:

    how did you arrive at 526.76 m^3/h = 310 GPM?
    310 GPM = 70.4 m^3/h

  5. Please send the excel formula sheet. This would speed up my calcs. Thanks you very much.
    Tony Gawrysiak
    Technical Manager
    ComfortPro Systems

  6. Paul Gerber says:

    Can you please send me the spreadsheet for friction pressure drop calculation? Thank you.

  7. Ken Juran says:

    Can you please send me the spreadsheet for friction pressure drop calculation? Thank you.

  8. Rom Ramones says:

    Can you please send me the spreadsheet for friction pressure drop calculation? Thank you.

  9. vamsi krishna prasad says:

    please send me the spread sheet to :sarada.vasireddy@gmail.com

  10. Juan Carlos says:

    Por favor hoja de calculo

  11. Juan Carlos says:

    enviarme a charleeinc@hotmail.es y muchas gracias

  12. Jordan Whetsell says:

    Could I please get the spreadsheet for calculations?

  13. Rik says:

    Where can I download the Friction Pressure Drop Calculation

  14. reza says:

    Can you please send me the spreadsheet ?

  15. SteWe says:

    Can you please send me the spreadsheet for friction pressure drop calculations? Thank you very much.

  16. SteWe says:

    Thank you!

  17. Gary S. says:

    Can you please send me a copy of the spreadsheet that you referred to? Thanks!

  18. Hey very interesting blog!

    My webpage … 24 hour ac repair 19107

  19. Fastidious respond in return of this question with genuine arguments and describing the whole thing regarding
    that.

    Also visit my site; sky broadband help telephone number

  20. It’s going to be finish of mine day, but before end I am reading this great article to increase my knowledge.

    Look into my webpage; you could try here (crawfordmwel.centerblog.net)

  21. Magnificent goods from you, man. I’ve understand your stuff previous to and you’re just extremely wonderful.
    I actually like what you have acquired here, certainly like what you are saying and the way in which you say it.
    You make it enjoyable and you still care for to keep it sensible.
    I can not wait to read much more from you. This is actually
    a great site.

  22. This will be a excellent web site, might you be interested in doing an interview regarding how you created it? If so e-mail me!

  23. Jon says:

    Hi Sr. very good note, please can i get the spread sheet jony_cosacurio@yahoo.com

  24. Norman Hein says:

    Interesting article and comparisons. I also would like the spread sheet calculator; but, wonder if there is one for gas flow or what are the factors that need to be changed for gas production considerations.

  25. cho says:

    this program very important to me please send this program

  26. Buy Proxies says:

    DreamProxies.com — cheapest high level private proxies with 50% low cost! Elite quality, Limitless proxies, Extremely speed and Cheapest price ranges : just $0.25 every proxy! Finest non-public proxies simply from DreamProxies.com

  27. Rene Groenewege says:

    Will you please send me a copy of your spreadsheet?

    It will greatly help me with my calculations.

    Thanks a lot for your help!!

  28. Will you please send me a copy of your spreadsheet?

  29. Glen Millar says:

    Will you please send me a copy of your spreadsheet?

  30. dani says:

    ” I am unsure where you’re getting your information, nevertheless great topic. I must spend some time learning or understanding more. Thank you for fantastic information. I was trying to find this information. “

  31. Diana says:

    Hello Joe, is it possible for you to send me the spreadsheet for a quick calculation? I would appreciate it. My email is tati_3217@hotmail.com

  32. Will there be a part 2 some time in the future? I simply have to tell you that your pages are really awesome. I was walking on the beach on Monday when I discovered your blog. Some really excellent information here. Try to make the guest blog as awesome as possible by promoting and dropping links. Wow, that is unbelievable.

Guidelines for Liquid Density Prediction – Part 2: Process Simulators

In the last two “Tip of the Month” we briefly discussed the importance of liquid density for process simulation and equipment design. Three different methods were introduced to compute liquid density. The methods were (a) charts and monographs, (b) correlations and (c) EoS or volume translated EoS. We also presented a comparison between accuracy of different correlations and EoS methods and provided guidelines for using correlations.

In this “Tip of the Month”, we will present a comparison between accuracy of HYSYS [1] and ProMax [2] process simulation packages which normally use correlations for liquid density calculations. For HYSYS we used the “Smooth Liquid Density” option and in ProMax there are two options of COSTALD [3, 4] and Rackett [5] but we only used the COSTAD method for the reasons discussed in the last tip of the month. Both of these methods are discussed in Chapter 3 of JMC Volume 1 of Gas Conditioning and Processing Book [6]. The focus will be on the mixture of light hydrocarbons which have wider applications in gas industry. We will provide guidelines to use these process simulation programs effectively. In this study we have used the experimental data reported in GPA Research Report RR-147 [7].

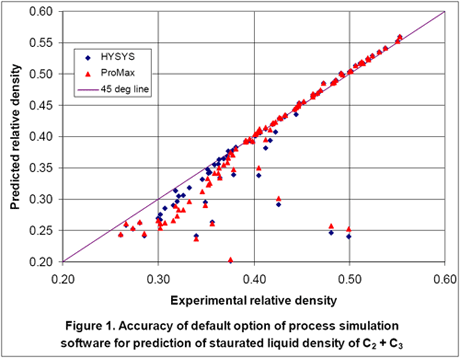
We predicted the saturated liquid density of the ethane-propane mixture for the conditions reported in the GPA research report using the default option of HYSYS and ProMax. For the default option for each set of experimental conditions, we entered temperature, pressure, composition and total number of moles (100 moles was used for all cases). In Figure 1, the predicted results for 90 points are plotted as a function of the experimental values.

Graph 1

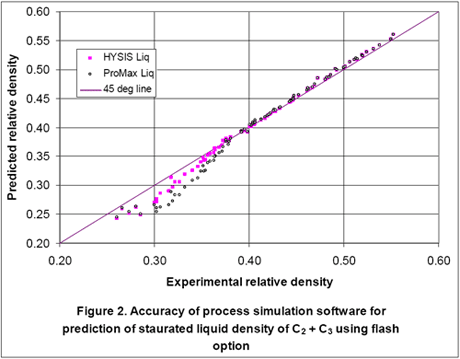
As can be seen in this figure, for several points the errors are very large. These large errors are due to the fact that for these points the process simulators predict partially vaporized systems and the reported densities are for a two phase mixture and not for the actual liquid mixture as reported experimentally. Therefore, we performed a flash calculation for each experimental point, separated the gas from the feed and predicted the density for the resulting liquid stream and re-plotted the results in Figure 2. This causes some changes in composition but Figure 2 indicates that considerable improvement in accuracy is obtained by degassing the feed stream.

Graph 2

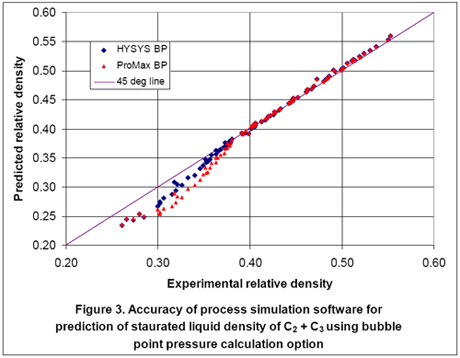
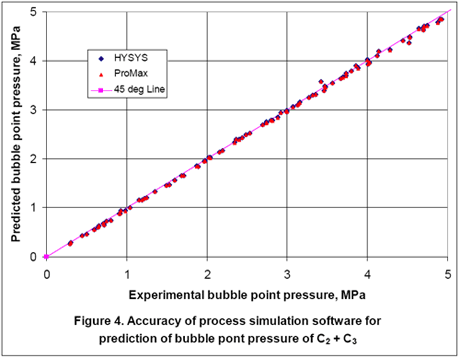
Since the reported experimental data were at saturated liquid conditions, a second option is to predict the liquid density using the bubble point option. For this option, we entered temperature, vapor fraction of zero, composition of components, and 100 moles for total feed. By performing bubble point calculation, the liquid density and bubble point pressure were calculated. Figures 3 and 4 show the accuracy of HYSYS and ProMax in predicting the liquid densities and bubble point pressures, respectively. Again, quite an improvement is obtained by performing bubble point calculation to obtain the liquid density.

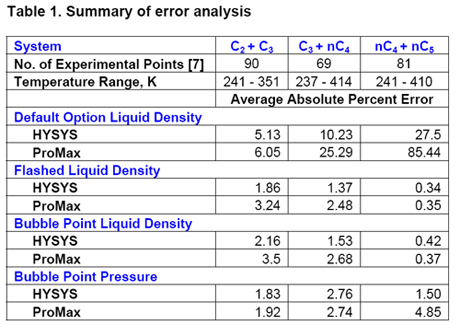
We repeated similar calculations for propane-normal butane and normal butane-normal pentane mixtures and have summarized in Table 1 the error analysis for different options using the simulation softwares.

Table 1 indicates that if the default option of HYSYS and ProMax are used, the calculated liquid density may contain a large error. On the other hand, when the mixture was flashed and the vapor was removed the calculated density was more accurate. Finally, calculating the liquid density using bubble point calculation yields more accurate density; however, the pressure may deviate slightly from the specified system pressure. The deviation of pressure does not cause a major concern because the pressure effect on liquid properties is not that much and more often it is ignored.

To learn more about liquid density and its impact on facilities calculation, design and surveillance, refer to JMC books and enroll in our G4 (Gas Conditioning and Processing) and G5 (Gas Conditioning and Processing – Special) courses.

By Dr. Mahmood Moshfeghian

Graph 3
Graph 4
Chart 1

Reference:

  1. HYSYS, version 2004.2, Aspen Technology Inc., Cambridge, Massachusetts, 2005.
  2. ProMax, version 1.2, Bryan Research & Engineering Inc, Bryan, Texas, 2005.
  3. Hankinson, R. W.; Thomson, G. H. A new correlation for saturated densities of liquids and their mixtures. AIChE J. 1979, 25, 653.
  4. Thomson, G. H.; Brobst, K. R.; Hankinson, R. W. An improved correlation for densities of compressed liquids and liquid mixtures. AIChE J., 28, 671, 1982
  5. Rackett, H. G. Equation of state for saturated liquids. J. Chem. Eng. Data, 15, 514, 1970
  6. Campbell, J. M. “Gas conditioning and processing, Volume 1: Fundamentals,” John M. Campbell and Company, Norman, Oklahoma, USA, 2001.
  7. Holcomb, C.D., Magee, J.W., and W.M. Haynes, “Density Measurements on Natural Gas Liquids,” Gas Processor Associations, RR-147, Tulsa, 1995.

Comments are closed.