The May 2015 tip of the month (TOTM) [1] presented a method which allows the users to estimate the decline of their adsorbent based on only one performance test run (PTR) for molecular sieve dehydrators using low pressure regeneration. This permits early formulation of a credible action plan. Site-specific factors will determines an adsorption unit’s decline curve. Consequently, conducting more than PTR is highly recommended. A poorly performing inlet separator, for example, could result in a unit exhibiting a more pronounced decline than indicated by the generic performance decline curves.
One can utilize the May 2015 TOTM methodology effectively by developing a spreadsheet or a computer program. Therefore, based on this methodology, we have developed a computer module to perform all of the calculations. This computer module has been coupled with the PetroSkills | John M Campbell GCAP (Gas Conditioning and Processing Software) [2]. This tip presents this computer model’s numerical and graphical results for the same case study of May 2015 TOTM.
The cyclical heating/cooling of the adsorbent results in a capacity (mass of water per 100 mass of adsorbent) decline due to a gradual loss of crystalline structure and/or pore closure. A more troublesome cause of capacity decline is contamination of the molecular sieves due to liquid carryover from the upstream separation equipment.
The molecular sieve capacity decline curve is an essential element of this methodology. Figure 18.8 in Gas Conditioning and Processing, Volume 2: The Equipment Modules (9th Edition) [3], presents a generic molecular sieve capacity decline curves. An expanded form of Figure 18.8 with five curves is shown in Figure 1. Shown in this figure are “Good”, “Good-Average (G_A)”, “Average”, “Average-Poor (A_P)”, and “Poor” curves that are a function of site specific factors. The life of the adsorbent is a function of the number of cycles, not the elapsed calendar time. Locating one data point on Figure 1 from a performance test run (PTR) allows us to generate the decline curve of the unit in question. For computer programming purpose, we have developed a simple mathematical model. For more detail regarding adsorption dehydration process see references [1 and 3].

Figure 1. A generic molecular sieve capacity decline curves
Case Study:
If your regeneration circuit has excess capacity over the “normal design conditions”, i.e., a design factor, you have standby time. This excess capacity allows you to reduce your online adsorption time and “turn the beds around” faster by regenerating the beds in a shorter cycle time. When you are involved in the design of an adsorption unit, it is recommended to add 10 – 20% excess regeneration capacity.
Because of the capacity decline curves flatten out, available standby time may be able to extend the life of a molecular sieve unit when your unit is operating on fixed cycle times. Other operating options include: running each cycle to water breakthrough; and, reducing the cycle times in discreet steps throughout the life of the adsorbent.
To demonstrate application of the developed program and illustrate the benefits of standby time we considered the same case study as in the May 2015 TOTM [1]. As shown in Figure 2, a natural gas processing plant has commissioned a new 3 tower molecular sieve dehydration unit to process 11.3 x 10⁶ std m3/d (400 MMscfd) prior to flowing to a deep ethane recovery unit. The unit is expected to run for 3 years before needing a recharge and the plant turnaround is based on this expectation. The following assumptions are made:
- A 3 tower system (2 towers on adsorption, 1 on regeneration)
- External Insulation
- Tower ID = 2.9 m (9.5ft)
- Each tower contains 24630 kg (54300 lbm) of Type 4A 4×8 mesh beads
- Regeneration circuit capable of handling an extra 15% of flow
- Available standby time 0.5 hour
- Unit is operated on fixed time cycles
- No step-change events such as liquid carryover, poor flow distribution, etc.
- Figure 2. Typical process flow diagram for a 3-tower adsorption dehydration system [3]
![Figure 2. Typical process flow diagram for a 3-tower adsorption dehydration system [3]](http://www.jmcampbell.com/tip-of-the-month/wp-content/uploads/2016/06/fig2-e1465223883118.png)
Figure 2. Typical process flow diagram for a 3-tower adsorption dehydration system [3]
The design basis and molecular sieve design summary are shown in Tables 1 and 2. The additional 15% of flow from the regeneration gas heater is well below the point at which bed lifting will occur.
![Table 1. Design basis for the case study [1]](http://www.jmcampbell.com/tip-of-the-month/wp-content/uploads/2016/06/table1.jpg)
Table 1. Design basis for the case study [1]
![Table 2. Design summary for the case study [1]](http://www.jmcampbell.com/tip-of-the-month/wp-content/uploads/2016/06/table2.jpg)
Table 2. Design summary for the case study [1]
Using the concepts outlined in chapter 18 of reference [3], the calculated design life factor, LF, is 0.60 after 3 years (Number Of Cycles, NOC = 1095) of operation at design conditions. This point lies slightly above the “average” life curve as seen in Figure 3. These calculated values will be presented in the computer output table on the following pages.
After 12 months of operation, a Performance Test Run (PTR) is conducted. The results are shown in Table 3. The feed flow rate and temperature are slightly lower compared to the design values. A water breakthrough time of 20.9 hours is recorded.
![Table 3. Results of Performance Test Run (PTR) after 12 months of operation [1]](http://www.jmcampbell.com/tip-of-the-month/wp-content/uploads/2016/06/table3.jpg)
Table 3. Results of Performance Test Run (PTR) after 12 months of operation [1]
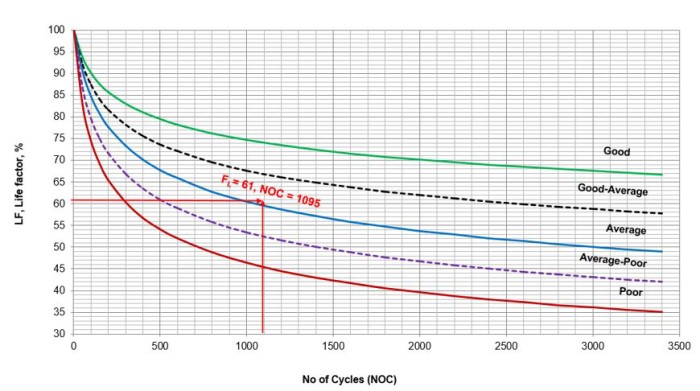
Figure 3. Design condition life factor (LF = 61.0 %) at NOC = 1095
Tables 4A and 4B present the input data for the developed program (GCAP Option 18F) in SI (System International) and FPS (foot-Pound-Second) systems of units, respectively. The input values for the saturation water content at operation and design conditions by default were zero. Therefore, the program predicted the water content and populated the corresponding input fields. Similarly, the program estimated the gas compressibility factors based on the gas relative density at the operation and design conditions. The program is capable of performing compound bed calculations. In this case study, only one size molecular sieve (MS) was specified; therefore, the mass and density of the second layer of MS are 0. As shown in Table 1, the current adsorption time is 16 hours; therefore, the step (total regeneration) time for this 3-tower system will be 8 hours.
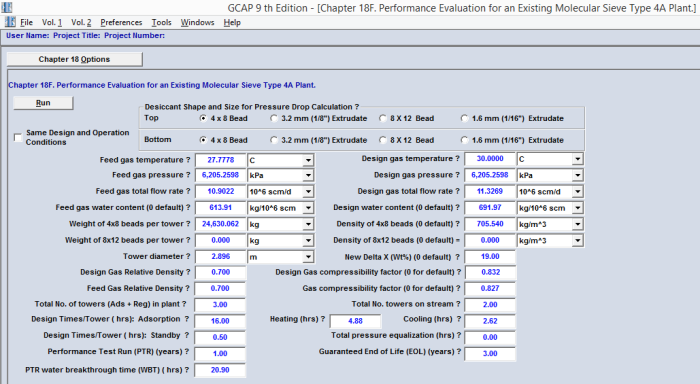
Table 4A. GCAP Option 18F input data for the case study (SI units)
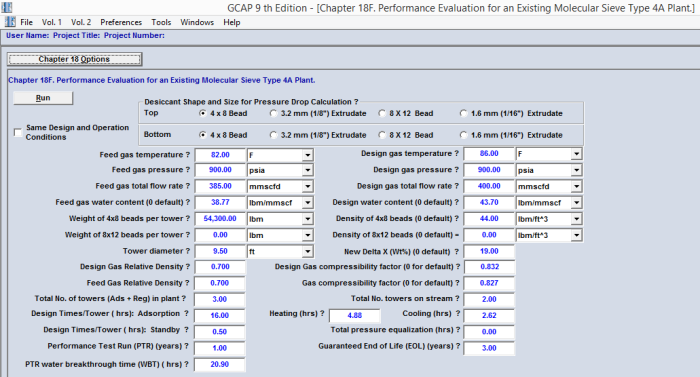
Table 4B. GCAP Option 18F input data for the case study (FPS units)
Tables 5A and 5B present the GCAP Option 18F numerical results for this case study in SI and FPS systems of units, respectively.

Table 5A. GCAP Option 18F numerical results for the case study (SI units)

Table 5B. GCAP Option 18F numerical results for the case study (FPS units)
The PTR LF is determined (using the concepts in Chapter 18 [3]) to be 0.675 after 365 cycles (one year of operation). It is important and useful to understand the equation sequence of the concepts in Chapter 18 [3], as shown by Equations 18.5 through 18.10 to arrive at the cited value for LF. This data point is labeled “OP1” (see the legend on top) and shown in Figure 4 and is seen to lie just between the generic “Average” and “A_G) curves. Based on this data point and the built-in mathematical model, GCAP Option 18F generates a performance curve labeled “Operation” and is shown in Figure 5. Note that the slope of the curves are starting to flatten out. Since the generated PTR curve is lower than the design LF curve, the molecular sieves will experience water breakthrough if operated at design conditions in less than three years.
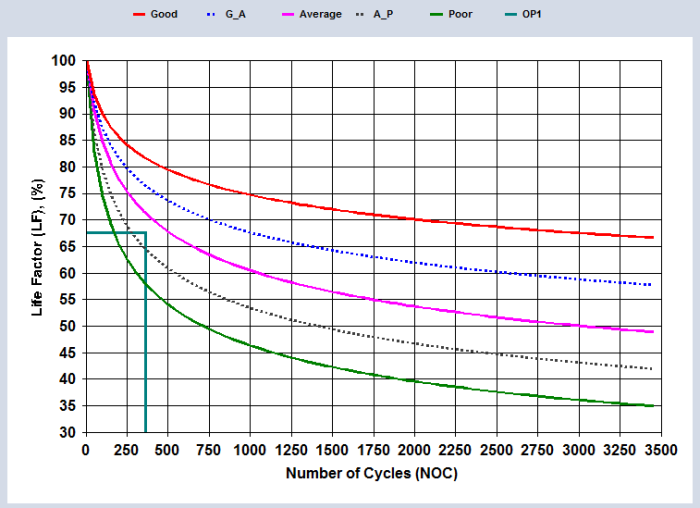
Figure 4. Performance test run (PTR) life factor (LF = 67.5%, NOC = 365)
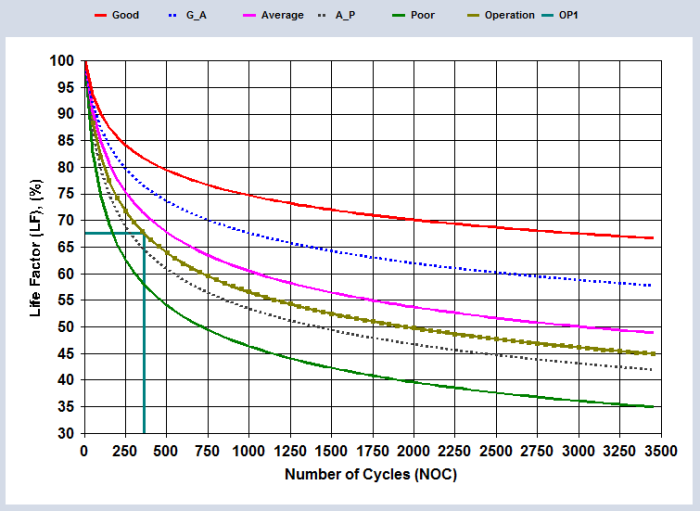
Figure 5. Projected life factor curve passing through PTR data point
Figure 6 shows the projected life factor, LF, after 3 years (NOC = 1095) of service at design conditions. From the projected curve, FL =0.556 for NOC = 1095. This data point is labeled “OP2”. If the capacity decline continues to follow the same trend as seen from the PTR curve, water breakthrough will occur after 802 cycles or just a little over 2 years from startup if operation continues at design conditions of LF = 0.589. This prediction compares favorably to the results of the May 2015 Tip of the Month. This data point is labeled “OP3” and shown in Figure 7.
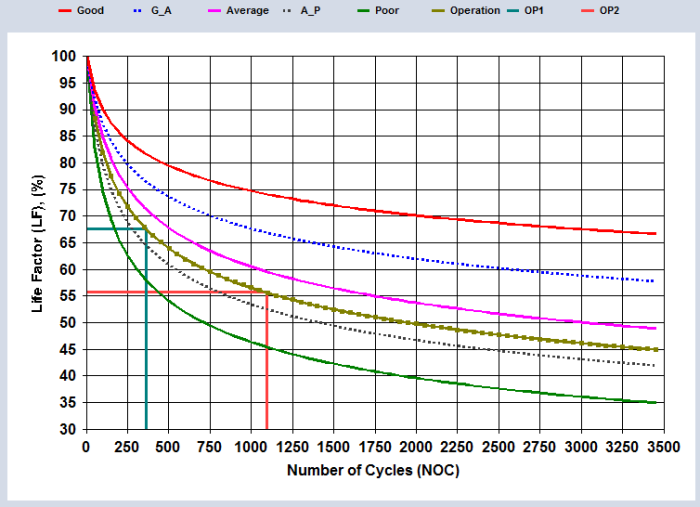
Figure 6. Projected life factor at 3 years (NOC = 1095) running at design conditions which gives LF = 55.6 %
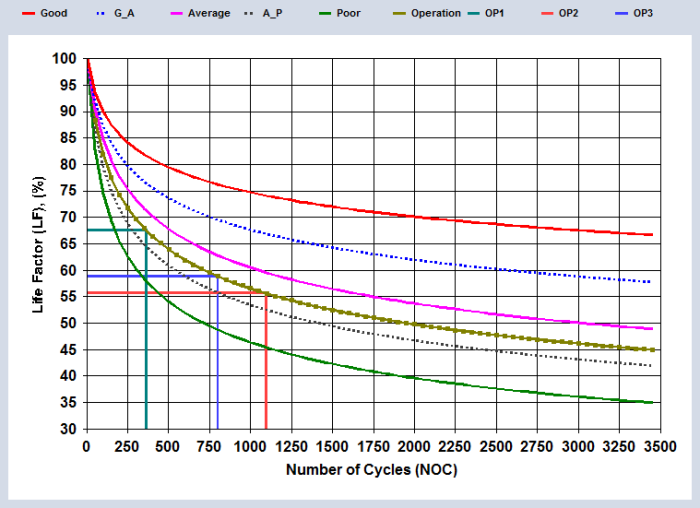
Figure 7. Projected life factor (LF = 58.9%) running at design conditions which gives NOC = 802
Because the unit has a regeneration circuit that can handle an additional 15% of flow, the complete regeneration cycle (heating, cooling, de-and re-pressurization and standby) can be reduced from 8.0 hours to 7.0 hours or an adsorption time of 14 hours instead of 16 hours. This allows the beds to turn around faster. Tables 6A and 6B are the same as Tables 4A and 4B with a revealed field to specify the revised adsorption time of 14 hours. Table 7 presents the additional program numerical results for the revised adsorption time of 14 hours.
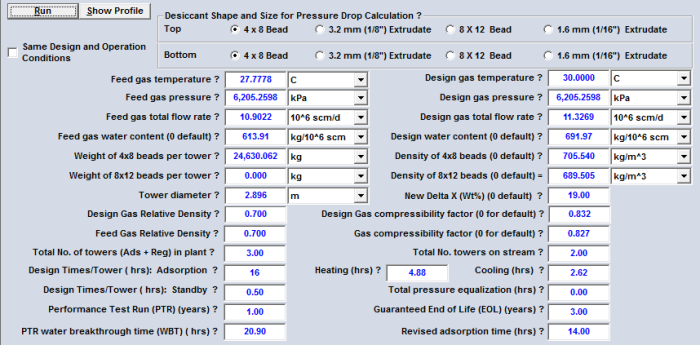
Table 6A. GCAP Option 18F input data with the revised adsorption time for the case study (SI units)
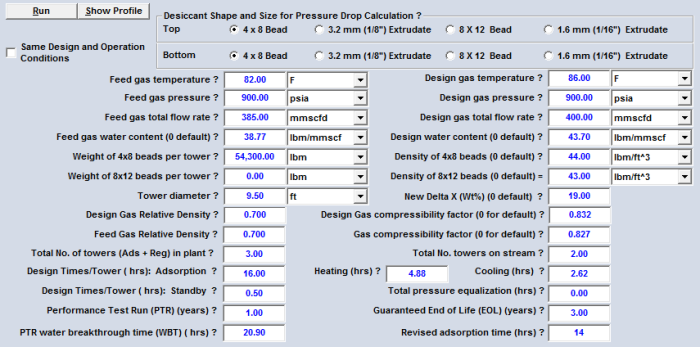
Table 6B. GCAP Option 18F input data with the revised adsorption time for the case study (FPS units)

Table 7. GCAP Option 18F program additional numerical results for the revised adsorption time of 14 hours
Using the reduced cycle time (the complete cycle time is now 21 hours vs the original 24 hours), we find an LF = 0.543. This is because less water is being adsorbed per cycle. This occurs at the 1250 (NOC = 365 + 886.4 = 1251.4) cycles labeled as “ROP” and shown in Figure 8 below. The May 2015 TOTM was based on visually interpolating the capacity decline curves. That method resulted in an LF = 0.53 which occurred around the 1500 cycle mark.
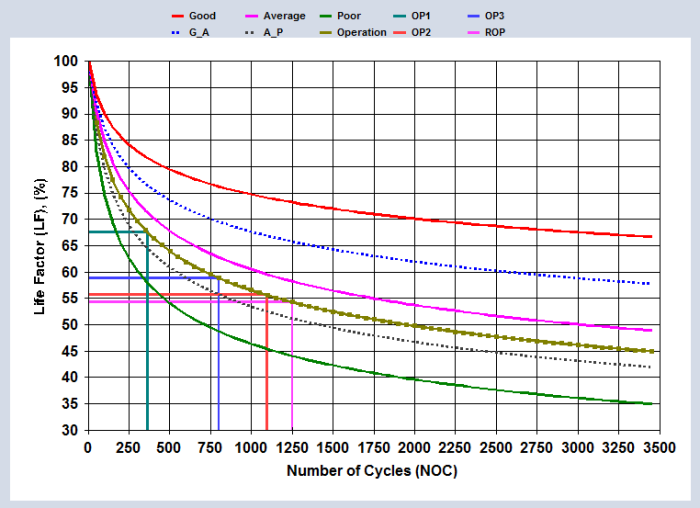
Figure 8. Projected life factor (LF = 54.3% and NOC = 1251.4) if standby time is used
If the plant elects to take advantage of the standby time and operate at reduced cycle time immediately following the PTR, the molecular sieves should last an additional 25.5 months (2.13 years), resulting in a total life of 3.12 years (the May 2015 TOTM methodology predicted a total life of 3.7 years). In this case, standby time will allow the unit to operate until the scheduled plant turnaround.
The different estimates of total life between the two methods is due to the flattening out of the decay curves. Very small changes in LF result in large differences in total number of cycles. There is inherent uncertainty in taking a data point from a curve using visual interpolation. GCAP eliminates this uncertainty.
For units where the estimation of total life is critical, it is recommended to run another PTR. For the Case Study under evaluation, this should occur approximately one year after the first PTR.
A free copy of the GCAP program can be obtained by attending PetroSkills – John M Campbell G4 (Gas Conditioning and Processing) course.
The approach discussed in this Tip of the Month should help a facility engineer plan for the inevitable replacement of molecular sieves in their natural gas dehydration facility.
To learn more about similar cases and how to minimize operational problems, we suggest attending our G4 (Gas Conditioning and Processing), G5 (Advanced Applications in Gas Processing), and PF4 (Oil Production and Processing Facilities) courses.
PetroSkills offers consulting expertise on this subject and many others. For more information about these services, visit our website at http://petroskills.com/consulting, or email us at consulting@PetroSkills.com.
By: Mahmood Moshfeghian and Harvey M. Malino
References:
- Malino, H.M., May 2015 tip of the month, PetroSkills – John M. Campbell, 2015
- GCAP 9.2.1 Software, PetroSkills – John M Campbell “Gas Conditioning and Processing Computer Program,” Editor Moshfeghian, M., PetroSkills, Katy, Texas, 2016.
- Campbell, J.M., “Gas Conditioning and Processing, Volume 2: The Equipment Modules,” 9th Edition, 2nd Printing, Editors Hubbard, R. and Snow–McGregor, K., Campbell Petroleum Series, Norman, Oklahoma, 2014.
