Design and Operation of Unconventional Surface Facilities; Stabilization Issues

This Tip of the Month (TOTM) discusses design and operational considerations of surface facilities for unconventional light oil shales. We will address the following questions:

Are you having vapor pressure issues in the winter? (One operator had 100,000bpd shut in for a month)

Are your tanks venting?

►Are you getting oxygen into the feed gas of your gas plant? (This can cause major corrosion damage to an amine treating plant. Amines are used as oxygen scavengers and the degradation products will cause severe corrosion in hot sections of the amine plant regeneration system)

►Do you have infinite recycling?

►Are you sending your VRU compressor suction / discharge liquids back to the stock tanks? (This will cause the TVP to increase. The liquids should be pumped forward into the sales gas with a positive displacement pump. See the August 2017 TOTM – Infinite Recycling impacts onCompression Systems [1].)


If you are experiencing any of these issues, your surface facilities are working as designed, and the problem is the design.

A typical East Texas oil battery design will not work when processing a very light oil or condensate.


True Vapor Pressure (TVP)

What are the variables you can control to affect the stock tank vapor pressure?

1. Temperature

2. Pressure

3. Residence Time

4. Height of Liquid in the Tank

Most unconventional plays are light oil and require an understanding of natural gas processing, phase diagrams and infinite recycles of NGL’s.

The composition and properties of the feed with Gas Oil Ratio (GOR) of 1000 SCF/STB (178 Sm3/STm3) used in this tip are presented in Table 1 [2]. The tip used UniSim [3] to perform all of the process simulations.


Table 1. Composition and properties for GOR 1000 SCF/STB (178 Sm3/STm3)  used for simulations [2]


In Figure 1, a heater treater operating at 120 °F (49 °C) and 65 psia (448 kPa) is flashed to a stock tank operating at 14.7 psia (101 kPa) and 110 °F (43 °C). The corresponding material streams are presented in tables 2 and 3. The resulting product has TVP of 13.56 psia (94 kPa). A key point here is that steady statesimulation is a series of single point flashes.  At each single point the calculations are at a liquid vaporinterface. Actual vessel and tank elevations are normally not included. To get the sales TVP of 13.56 psia(94 kPa) a final flash must occur at 14.7 (101 kPa)  psia and 110 °F (43 °C) at the liquid / vapor surface. If the stock tank is 20 ft (7 m) tall and is bottom fed then the fluid can have a higher vapor pressure due to the height of the tank liquid head preventing the final flash at 110 F (43 °C) and 14.7 psia (101 kPa).


Figure 1Process flow diagram for single point flashes


Table 2. Material streams of Figure 1 FIELD

Table 3. Material streams of Figure 1 SI


Stock Tanks are typically 200 ft (60 M) from the heater treater. The heated oil from the heater treater will not arrive at 110 °F (43 °C) in the stock tanks through uninsulated lines in the winter when ambient conditions are -40 °F (-40 °C) and the wind is blowing. In the winter time, if the tanks are uninsulated and unheated it’s difficult to meet the TVP specs. Simulations will show that if the tank temperature falls below 90 °F (32 °C) then the TVP spec will not be met.

Figure 2 presents typical summer operation conditions. A summary of operation considerations:

Oxygen into the gas system to gas plant; severe damage to amine plant

Tank venting; loss of revenue / stock tank vapor

Tank head adds to RVP/TVP (20ft / 2.31) = 8.65 psi (160 kPa)

Meets RVP / TVP

No static electricity issues in bottom fed tank
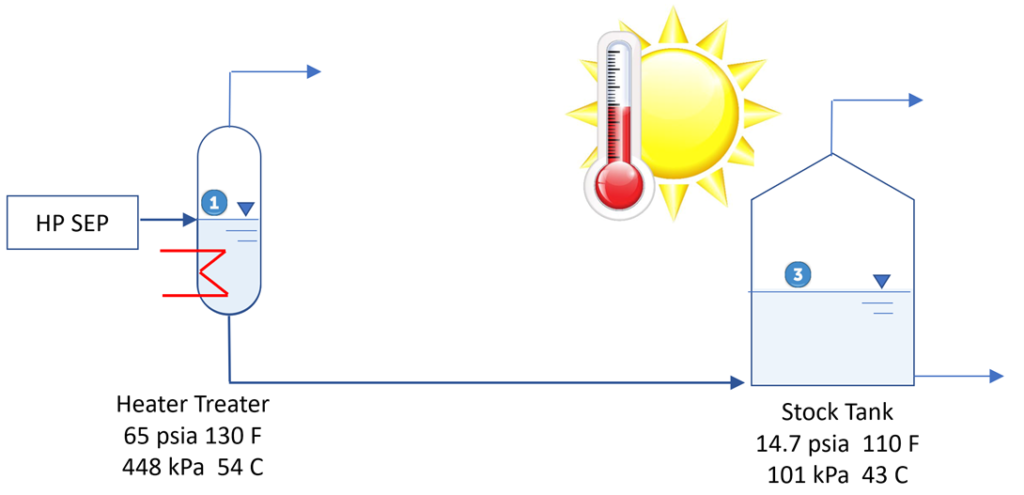
 

Figure 2Typical summer operation which meets TVP


Figure 3 presents a typical winter operation conditions. A summary of operation considerations:

Fails RVP / TVP at 90 °F ( 32 °C)and below

Oxygen into the gas system to gas plant; severe damage to amine plant

Tank venting; loss of revenue

Tank head adds to RVP/TVP

Uninsulated piping and tanks

No static electricity issues in bottom fed tank
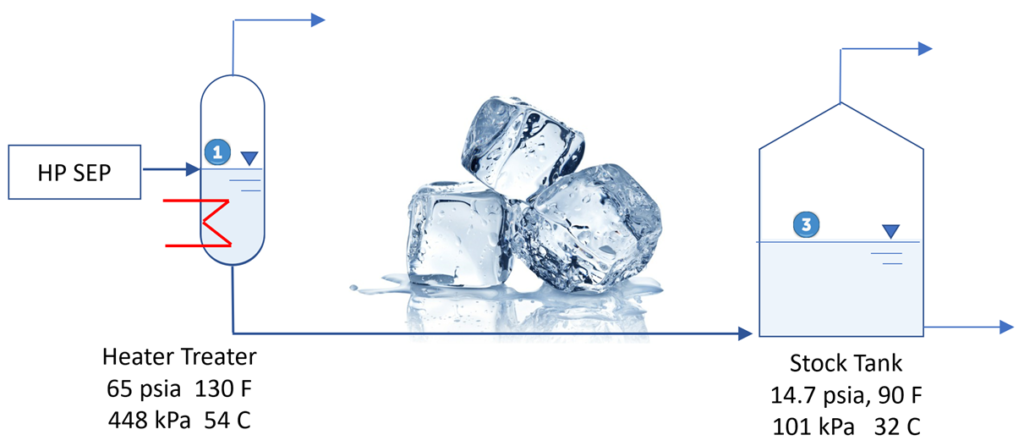


Figure 3Winter operation – final flash at required conditions cannot occur and TVP is not met.


Figure 4 shows a vapor recovery tower (VRT) and its operating conditions. The heater treater and VRT to the left of the dashed red line are hot and insulated. Items to the right do not require insulation.  The important flash to meet TVP occurs at point #2 and the liquid leaving the VRT meets TVP specification regardless of how cold the oil becomes flowing to the right. Practically, the three pieces of equipment (Heater Treater / VRT / Stock Tank) should be located close to each other.


The final flash from the cyclonic separator ensures that oil level tank head does not negatively impact the TVP and that the final flash will occur at the stock tank pressure of 8 oz/in2 (0.5 psia) (3.4 kPa) and high temperature. A summary of operation considerations:

Meets RVP / TVP at point # 2

No oxygen into the gas system

No stock tank vapor

30% lower VRU power

No tank venting

More revenue

Tank head no impact to RVP/TVP

Insulated treater & VRT – not entire battery

No static electricity issues in top fed tank


Figure 4Vapor recovery tower (VRT)


Figure 5 presents a process flow diagram for shale oil stabilization using VRT. Table 3 presents the material streams for the same PFD. Note liquid at point #2 VRT conditions meets TVP and no vapor is generated in stock tanks at 100 °F ( 38 °C) (Increased $$$).
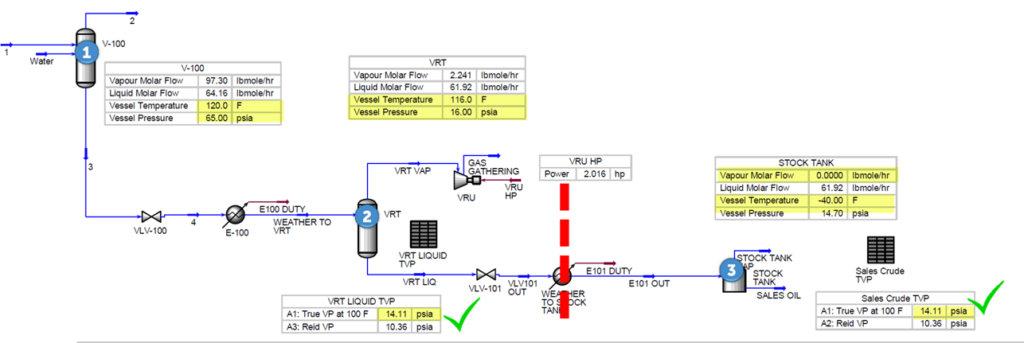
 

Figure 5. Shale oil stabilization using VRT


Table 4. Material streams in Figure 5 FIELD


Table 5. Material streams in Figure 5 SI


Figure 6 shows a typical unconventional light oil facility block diagram. Note the vapor recovery tank (VRT) and the dashed black break line. It separates the vapor recovery system from the tanks.  The stock tanks have extremely low vapor rates, which reduces venting and increases revenue.


Figure 6. Typical unconventional surface facilities block diagram


Do you have a VRT in your design?

If you don’t you probably have vapor pressure issues and oxygen in the sales gas from the stock tanks and water tanks connected to the vapor recovery system.

The VRT operates at 1-5 psig (108-138 kPa) and is approximately 36” (1 m) in diameter and 35 (12 m) ft tall. The feed enters the top vapor space. This provides a pressure break from the stock tanks and prevents oxygen from entering your gas system. It also provides a final flash with no tank liquid head. If stock tanks are fed from the bottom, they will have 20 ft (7 m) (8.6 psig) (160 kPa) of liquid head which will add to the TVP if the tanks are not well mixed or the rates are high to prevent equilibrium.

It’s extremely important that the VRT is insulated and heated to ensure that this final flash occurs at more than 110 °F (43 °C) at the top of the tower and at 1-5 psig (108-138 kPa).  Some designs use the hot exhaust gas from vapor recovery compressors to heat coils within the VRT. If you experience cold winters in West Texas or the Bakken, then make certain the VRT is heated, insulated, and close coupled to the heater treater. This also means that the stock tanks do not require insulation. The final critical flash has already taken place at the top of the heated VRT. The oil out of the VRT should also enter the top of the stock tank to ensure the last flash occurs at the lowest possible pressure. This can be accomplished via a small external cyclone whose outlet gas enters the top of the tank and whose liquid line enters the bottom of the tank. This liquid dip line ensures that no static electricity build up occurs with the liquid falling into the tank.

Some designs without VRT’s have approximately 200 ft (60 m)of distance between the heater treater and the stock tanks. In the winter the fluid from the treater cools on its way to the tanks and does not have an opportunity to have its final flash at 1 psig (108 kPa) and 110 °F (43 °C).  If the tanks are uninsulated reflux condensation of propane and butane occurs further increasing the vapor pressure.

Another benefit of the VRT design is that gas will not be breaking out in the stock tanks causing venting. The tanks will be safer for your operating personnel to gauge.

The pressure break that the VRT provides also isolates the VRU system from pressure surges caused by fluctuating tank levels during loading / unloading.


Alternative Designs:

Here is something to consider if you have a field with 600 existing oil batteries and no VRT’s. Install a central condensate stabilizer for use in the winter.  It requires double handling of the crude oil, but less CAPEX than modifying the existing batteries.

One Operator in West Texas is installing a Tankless Design using production separator clusters where production is sent to 3 phase separators where Oil, Gas, and Water are separated, metered, and sent via pipelines to Central Oil Treating and Stabilization Plants for final processing prior to sale.  Eliminates Trucking, Increases Revenue by eliminating Flaring / Emission Control Devices from tanks.

Another design to consider is a heated wash tank or gun barrel tank.  It’s a combination of a VRT and a stock tank. Figure 7 presents an internally heated wash tank


Figure 7Internally heated wash tank


A Heated wash tank / gun barrel tank will have similar process performance to a VRT. Figure 8 presents a heated wash tank. The wash tank is not used to perform its normal oil / water dehydration performance, but to provide heat for the final flash at low pressure and to provide a liquid seal to prevent oxygen entering the system, reduce vapor recovery unit (VRU) horsepower, and eliminate the final flashing of gas and loss of revenue in the oil stock tanks. A summary of operation considerations is:

Meets RVP / TVP at point # 2

No oxygen into the gas system

No stock tank vapor; 30% lower VRU power

No tank venting; more revenue

Tank head no impact to RVP/TVP

Insulated treater & VRT – not entire battery

No static electricity issues in top fed tank


Figure 8A heated wash tank can have similar performance to a VRT


Process Safety: Hot Oiling

Some operators use hot oil trucks to circulate their cold oil stock tanks to provide the heated flash in the winter. If the amount of propane and butane in the cold oil flash gas exceeds the limits of the thermal oxidizer, then it shuts down and the tanks will overpressure and vent locally. Venting of heavier than oil hydrocarbons particularly LPG is extremely dangerous and can lead to an unconfined vapor cloud explosion (UCVE). Hot oil trucks are direct fired and are an ignition source.

The following is an incident involving a hot oil truck at a surface facility.


 “Posted on February 3, 2018 by Site Admin in News, Oilfield1  [4]:

HOBSON (Karnes County TX) – A worker continues to recover from burns after officials say he was injured when his truck caught fire at a tank battery off Farm-to-Market Road 81, which is operated by 1776 Energy Operators, LLC.

According to Texas Railroad Commission (RRC) spokesman Ramona Nye, the blaze erupted at about 4 p.m. Wednesday, Jan. 24, when a worker from Engineered Well Services drove up to service a crude oil tank. His truck burst into flames, igniting two tanks containing produced water and four that held crude oil.” [4]

Weather reports indicate a low of 43 °F  (6 °C) the night before.


Some typical process safety issues to consider are listed below:

Was the lease operator present?

Was there a signed hot work permit?

Was there a JSA?

Do they monitor wind speed and direction?

Do they shutdown other operations / trucking during this type of operation?


Summary

To control vapor pressure light oil the following method / equipment can be used:

Vapor recovery tower (VRT)

Heated wash tank

Condensate stabilizer

Reduce tank levels

Heat and insulate


For optimal operation, you should consider a heated gun barrel tank that is heated by an external furnace, installing a condensate stabilizer to maximize revenue and meet pipeline/trucking TVP specifications. Additionally, avoid infinite recycling of LPG by running your compressor discharge temperatures hot enough to prevent hydrocarbon liquid condensation and provide positive displacement pumps to continually move the condensed LPG into the sales gas line.


To learn more about similar cases and how to minimize operational problems, we suggest attending ourG4 (Gas Conditioning and Processing), G5 (Advanced Applications in Gas Processing)PF3 (Concept Selection and Specification of Production Facilities in Field Development Projects)PF4 (Oil Production and Processing Facilities)PF49 (Troubleshooting Oil & Gas Processing  Facilities), and PS4 (Process Safety Engineering) courses.

Check out the on-demand webinar based on this Tip of the Month: UNCONVENTIONAL SURFACE FACILITIES DESIGN TIPS

Written By: James F. Langer, P.E.


Did you enjoy this article? To have Tips of the Month sent to your email, simply sign up below. 


References

1. Langer, J., Infinite Recycle Impacts on Compression Systems, PetroSkills tip of the month, Aug 2017

2. Zangeneh, B., “UNDERSTANDING RESERVOIR ENGINEERING ASPECTS OF SHALE OIL DEVELOPMENT ON THE ALASKA NORTH SLOPE,” M.S. Thesis, University of Alaska Fairbanks, May 2014.

3. UniSim Design R443, Build 19153, Honeywell International Inc., 2017.

4. https://oilfield1.com/2018/02/03/explosion-prayers-for-oilfield-worker-recovering-after-tanker-explosion-in-south-texas


Further Reading:

Moshfeghian, M., Correlations for Conversion between True and Reid Vapor Pressures (TVP and RVP), PetroSkills tip of the month, Feb 2016

Moshfeghian, M., Correlations for Vapor Pressure of Crude Oil Measured by Expansion Method (VPCRx), PetroSkills tip of the month, Nov 2017

Conder, M W and Lawlor, K A; “Production and Processing, Production Characteristics of Liquids-Rich Resource Plays Challenge Facility Design,” American Oil and Gas Reporter- Editor’s Choice, May 2014.

https://www.aogr.com/magazine/sneak-peek-preview/production-characteristics-of-liquids-rich-resource-plays-facility-design

Conder, M W, and Schroer, A D; “Production Facility Design, Simulation Workflow Optimizes Facility Design for Producing Multiwell Pads,” American Oil and Gas Reporter- Editor’s Choice, May 2015.

InterTek, http://www.intertek.com/ngl-condensate-boiling-video/), 2018.

Comments are closed.

Methyl Diethanolamine (MDEA) Vaporization Loss in Gas Sweetening Process

In natural gas treating, there are several processes available for removing acid gases. Aqueous solutions of alkanolamines are the most widely used [1]. The alkanolamines process is characterized as “mass transfer enhanced by chemical reactions” in which acid gases react directly or react through an acid-base buffer mechanism with alkanolamines to form nonvolatile ionic species. For further detail of sour gastreating refer to references [1-6].

According to Seagraves et al. [6], amine vaporization and degradation losses constitute a small portion of the overall solvent losses which can be by mechanical means, entrainment due to foaming and solubility, and vaporization and degradation. “The vaporization and degradation account for as little as 3% of the overall solution losses” [6]. However, it can be significant at lower pressures.

In this Tip of The Month (TOTM), the effect of pressure and temperature on the MDEA vaporization loss from the contactor top, regenerator top and flash gas is investigated. Specifically, this study focuses on the variation of MDEA vaporization losses with the feed sour gas pressure in the range of 5.52 MPa to 8.28 MPa (800 psia to 1200 psia). For each pressure, temperature varied from 21.1 °C to 48.9 °C (70 °F to 120 °F).

By performing the rigorous computer simulations of an MDEA sweetening process, several charts for demonstrating the impact of pressure and temperature on the MDEA vaporization loss and other operating parameters like the lean MDEA solution circulation rate are presented.


CASE STUDY:

For the purpose of illustration, this tip considers sweetening of 2.84 x 10⁶ Sm3/d (100.2 MMSCFD) of a sour natural gas using MDEA. Table 1 presents its composition and flow rate. The feed sour gas pressure was varied from 5.52 MPa to 8.28 MPa with an increment of 0.690 MPa (800 psia to 1200 psia with an increment of 100 psia). For each pressure, the temperature was varied from 21.1 °C to 48.9 °C with an increment of 5.5 °C (70 °F to 120 °F with an increment of 10 °F). This tip uses ProMax [1] simulation software with “Amine Sweetening – PR” property package to perform all of the simulations.


Table 1. Feed composition and flow rate


Figure 1 [7] presents a typical sweetening process flow diagram for the case study. Note this diagram has a trim cooler to control the top temperature of the absorber and a reflux condenser that minimizes the water and MDEA losses via the acid gas stream.


Figure 1Simplified process flow diagram for an amine sweetening unit [7]


The following specifications/assumptions for the case study are considered:

Absorber/Contactor Column

►Feed sour gas is saturated with water

►Number of theoretical stages = 7

►Pressure drop = 20 kPa (3 psi)

►Lean amine solution temperature  = Sour gas feed temperature. Typically lean solution should be 5.5 °C (10 °F) higher than feed gas, but there is no concern about hydrocarbon dewpoint for this feed.


Regenerator/Stripper Column

►Number of theoretical stages = 10 (excluding condenser and reboiler)

►Feed rich solution pressure = 414 kPa (60 psia); typically stream 6 have a letdown valve to reduce pressure to the stripper column pressure.

►Feed rich solution temperature = 98.9 °C (210 °F ); this is conservative and could be 107 °C at 414 kPa (225 °F at 60 psia)

►Condenser temperature = 48.9 °C (120 °F ); this reflects warm climate with aerial cooler

►Pressure drop = 21 kPa (3 psi)

►Bottom pressure and temperature = 214 kPa (31 psia), about 126 °C (259 °F)


Reboiler Duty

►Steam rate = 132 kg of steam/m3 of amine solution (1.1 lbm/gallon) times amine circulation rate

►Saturated steam pressure = 348 kPag (50 psig) at 147.7 °C (297.7 °F)


Heat Exchangers

►Lean amine cooler pressure drop  = 35 kPa  (5 psi)

►Rich side pressure  = 35 kPa (5 psi)

►Lean side pressure  = 35 kPa (5 psi)


Main Pump

►Discharge Pressure = Feed sour gas pressure + 35 kPa (5 psi)

►Efficiency = 65 %


Reflux Pump

►Discharge Pressure = 350 kPa (50 psi)

►Efficiency = 65 %


Lean Amine Concentration and Circulation Rate

►MDEA concentration in lean amine = 50 weight %

►Lean amine circulation rate was adjusted (by solver tool) to reduce the H2S concentration in sweet gas to 4 ppmv (The calculated rates resulted in a total acid gas loading in rich solution in the range of ~0.28 to0.54 mole acid gases/mole of MDEA)

►Total acid gas loadings in lean solution in the range of ~0.002 to 0.004 mole acid gases/mole of MDEA


Rich Solution Expansion Valve

►Flash tank pressure = 448 kPa (65 psia)


RESULTS AND DISCUSSIONS

For the above specifications, ProMax [7] is used to simulate the process flow diagram in Figure 1. The objective was to produce a sweet gas with 4 ppmv H2S and less than 3 mole % CO2. In order to meet these specifications, the required lean MDEA solution volumetric rate was determined by the solver tool and then the calculated operation parameters were recorded. The following properties are reported here and the rest are presented in the Appendix.


1. MDEA circulation rate and total rate of MDEA vaporization losses in

►Sweet gas

►Flash gas from the amine flash tank

►Acid gas from regenerator/stripper

2. H2S, CO2, and total acid gas loadings (mole acid gas/mole MDEA) in

►Lean amine

►Rich amine

3. H2S and CO2 concentration in the sweet gas.

4. Heat duties

►Regenerator/Stripper condenser and reboiler

►Lean-Rich exchanger

►Lean amine (trim) cooler

5. Pump power requirements

►Reflux pump

►Main pump


Five feed gas pressures and for each pressure 6 temperatures were simulated. For clarity and to avoid crowded curves on the diagrams, only the results for the lowest, the average and the highest pressures are presented.

The variation of operational parameters as a function of pressure and temperature are presented in Figures 2 through 6 for the lean MDEA solution rate, total MDEA vaporization loss, ratio of the MDEA loss in sweet gas to loss in flash gas, mole % of CO2 in the sweet gas, and the total acid gas loadings in the lean and rich MDEA solutions, respectively. Even the lean amine temperature was set equal to feed gas temperature, the top tray and sweet gas temperatures from overhead were 5.5 °C to 11 °C (10 °F to 20 °F) higher than the feed gas temperatures. In all cases, the sweet gas pressure was 21 kPa (3 psi) lower than the feed gas pressure.

Figure 2 presents the variation of the lean MDEA solution rate, in the standard cubic meter per hour, Sm3/h (standard gallon per minute, sgpm), as a function of feed sour gas pressure and temperature. Figure 2 indicates that as the sour gas temperature increases the required lean MDEA circulation rate increases. However, as the sour gas pressure increases the required lean MDEA solution decreases. As expected the absorption process works better at a lower temperature and higher pressure.


Figure 2. Variation of lean MDEA volumetric rate with pressure and temperature


MDEA vaporization losses can occur with the sweet gas, flash gas and acid gas streams which are replaced by MDEA in the makeup stream. Figure 3 presents the variation of the rate of total MDEA vaporization losses as a function of the feed sour gas pressure and the sweet gas temperature. Figure 3 indicates that as the feed gas pressure and temperature increases the rate of total MDEA vaporization losses increases. For a given circulation rate, the rate of vaporization loss typically increases with increasing temperature but decreases with increasing pressure. However, as presented in Figure 2, the lean MDEA circulation rate increases with temperature.

A combination of the increasing effect of temperature and circulation rate overcomes the decreasing effect of higher pressure on the vaporization rate. In other words, at higher pressure the circulation rate is a bit lower, which means for the same gas inlet temperature, the sweet gas temperature is a bit higher and then MDEA losses are a bit higher. The low rate of MDEA vaporization loss is in agreement with the values in Fig 1 reported by Teletzke and Madhyani for 50 weight %  MDEA at high pressure of 6.21 MPa (900 psia) [8]. The MDEA vaporization losses from the top of the stripper/regenerator column were practically zero.


Figure 3. Variation of total MDEA vaporization loss with pressure and temperature


Figure 4 presents the variation of the ratio of MDEA vaporization loss in sweet gas to the loss in flash gas (mass basis) with pressure and temperature. Figure 4 indicates the losses with sweet gas is about 150 to 4600 times higher than the losses with flash gas. This figure verifies that major vaporization losses occur at the absorber/contractor overhead.


Figure 4. Variation of the ratio of MDEA vaporization loss in sweet gas to loss in flash gas (mass basis) with pressure and temperature


Figure 5 presents the variation of CO2 concentration in the sweet gas as a function of the feed sour gas pressure and temperature. The calculated CO2 concentrations in the sweet gas were from 1.2 to 2.6 % which are less than the specified value of 3 mole % for all pressures and temperatures considered. Figure 5 indicates that as the feed sour gas temperature increases the CO2 concentration in the sweet gas decreases. However, the feed sour gas pressure has a small effect on CO2 mole % at low temperature but at higher temperature CO2 mole % decreases as pressure increases. At higher temperature the MDEA circulation rate increases, which reduces the CO2 concentration in the sweet gas.


Figure 5. Variation of CO2 concentration in sweet gas with pressure and temperature


Figure 6 presents the variation of the total acid gas loadings in the lean and rich solutions as a function of the feed sour gas pressure and temperature. Figure 6 indicates that the lean solution acid gas loading is practically independent of the feed sour gas pressure but decreases with the temperature increase. At higher temperature, more acid gas comes out in the flash, and less acid gas goes to the regenerator. The fixed steam rate then does a better job at stripping. Some systems have a low pressure contactor on the flash gas, which would recapture the acid gases and perhaps change this result. Figure 6 also indicates that as the feed sour gas temperature increases the rich solution total acid gas loadings decrease but increases with increasing pressure. At higher temperature the circulation rate increases and lowers the total acid gas loadings. The acid gas pick-up increases with higher temperature, as the CO2 content of the sweet gas decreases. Rich loadings are lower due to increased circulation rate.  Circulation rate increases faster than the increase in CO2 pickup.


Figure 6. Variation of lean and rich MDEA solution loadings with pressure and  temperature


CONCLUSIONS:

Based on the results obtained for the considered case study, this TOTM presents the following conclusions:

1. As the feed gas temperature to the contactor column increases, the lean MDEA solution rate increases whereas pressure has an opposite effect (Fig 2).

2. As the feed gas temperature to the contactor column increases, the total MDEA vaporization losses increase (Fig 3).

3. As the feed gas pressure to the contactor column increases, the total MDEA vaporization losses increase (Fig 3); however, vaporization losses can be significant in systems operating at very low pressure or with high contactor overhead temperatures.

4. The MDEA vaporization loss from the contactor top is about 150 to 4600 times higher than the loss with flash gas (Fig 4). The MDEA vaporization loss from the top of still/regenerator column is practically zero.

5. The CO2 mole % in sweet gas decreases with increasing temperature due to a higher circulation rate and better kinetics for CO2 absorption (Fig 5).

6. The lean and rich total acid gas loadings decrease with the feed sour gas temperature increase due to the higher circulation rate (Fig 6), whereas pressure has a smaller effect in the opposite direction.

7. Even though not studied in this TOTM, mechanical and entrainment losses from the contactor top and regenerator top, as well as losses due to filter change, are also sources of loss much higher than the vaporization losses presented here.

To learn more about similar cases and how to minimize operational troubles, we suggest attending our G6(Gas Treating and Sulfur Recovery), G4 (Gas Conditioning and Processing), G5 (Advanced Applications in Gas Processing), PF4 (Oil Production and Processing Facilities) and PF49 (Troubleshooting Oil and Gas Processing Facilities) courses.

Written By: Dr. Mahmood Moshfeghian


Sign up to receive Tip of the Month email updates!


REFERENCES

1. Maddox, R.N., and Morgan, D.J., Gas Conditioning and Processing, Volume 4: Gas treating and sulfur Recovery, Campbell Petroleum Series, Norman, Oklahoma, 1998.

2. Campbell, J.M., Gas Conditioning and Processing, Volume 2: The Equipment Modules, 9th Edition, 1st Printing, Editors Hubbard, R. and Snow –McGregor, K., Campbell Petroleum Series, Norman, Oklahoma, 2014.

3. GPSA Engineering Data Book, Section 21, Volume 2, 13th Edition, Gas Processors and Suppliers Association, Tulsa, Oklahoma, 2012.

4. Moshfeghian, M., Bell, K.J., Maddox, “Reaction Equilibria for Acid Gas Systems, Proceedings of Lawrence Reid Gas Conditioning Conference, Norman, Oklahoma, 1977.

5. Moshfeghian, M., July 2014 tip of the month,  PetroSkills – John M. Campbell, 2014.

6. Seagraves, J., Quinlan, M., and Corley, J., “Fundamentals – Gas Sweetening ”, Laurance Reid Gas Conditioning Conference, Norman, Oklahoma February 21 – 24, 2010

7. ProMax 4.0, Build 4.0.17179.0, Bryan Research and Engineering, Inc., Bryan, Texas, 2017.

8. Teletzke, E.  and Madhyani, B.,  “Minimize amine losses in gas and liquid Sweetening”, Laurance Reid Gas Conditioning Conference, Norman, Oklahoma February 26 – March 21, 2017.


APPENDIX


Figure 7. Variation of sour gas temperature with feed gas pressure and temperature


Figure 8. Variation of pumps power with feed gas pressure and temperature


Figure 9. Variation of reboiler and condenser duties with feed pressure and temperature


Figure 10. Variation of Lean-Rich HEX and cooler duties with feed gas pressure and temperature

3 responses to “Methyl Diethanolamine (MDEA) Vaporization Loss in Gas Sweetening Process”

  1. GESNER ANDRADE NERY JUNIOR says:

    Hello,
    I would like to be notified about new posts by email.
    Best regards

  2. GESNER ANDRADE NERY JUNIOR says:

    Hello,
    I would like to be notified about new posts by email.
    Best regards

  3. VHAsJlFnQfoM says:

    131478 7127Some truly nice stuff on this web site , I it. 739845

Nine Practical Tips for Motivating Oil and Gas Teams

This Tip of the Month (TOTM) discusses practical tips that have yielded strong positive results on oil and gas projects.


WHAT IS THE KEY TO ANY SUCCESSFUL PROJECT?

Reports are great and useful tools, but the most important factor to a successful project is PEOPLE. This Tip of the Month discusses practical tips that have yielded strong positive results on oil and gas projects. The most important factor to a successful project is PEOPLE. There are many books, processes, measures, graphs, reports, meetings, web pages and software products for monitoring projects, but most of these miss the key to a successful project. Processes and skills, with the right tools, at the right time coupled with MOTIVATION is the major key to success.


Many cost estimates are based on the average productivity of the average worker. Welding, for example, has many tables calculating inch/day completed for a given pipe diameter and pipe schedule. But what if you could get superior results, and not spend more money? What if you could create a project culture that motivates your workers to dramatically exceed expectations for no additional money or even save money? And that there is a scientific basis that has been known in business schools of management since the 1950s. Develop a MOTIVATION MINDSET for your project…How can I increase motivation?


SCIENTIFIC BASIS FOR MOTIVATION:

Herzberg [1] describes how to motivate employees. He presented a hypothesis which  has been validated in 12 investigations (Figure 1), and the results are repeatable and should resonate with you. It will with your project team! Herzberg indicates that there are two factors that motivate or demotivate people. He calls them intrinsic motivators and extrinsic hygiene factors.


Figure 1. Factors affecting job attitudes as reported in 12 investigations [1]  


Extrinsic Hygiene Issues: These are things that normally exist in any project and are similar to table stakes. For example, salary is not identified as a major source of motivation. You need to meet competitive salaries, but increasing the salary past that point will not increase or decrease motivation. You can see from Figure 1 that the major source of job dissatisfaction is the hygiene issue, company policy or administration. Herzberg indicates that these issues are extrinsic and can result in disciplinary action. (Bureaucracy)


Intrinsic Motivators: The strongest motivators for job satisfaction were achievement and recognition. This is why the polo shirts work every time. It couples recognition and achievement.

The take away from this as a project manager is to look for ways to recognize achievement and remove red tape and bureaucracy!


9 Practical Tips for Motivating Oil and Gas Teams

Tip # 1:  Team T-shirts/Polo Shirts/Baseball Caps/Coverall Patches/Hardhat Stickers


Motivator(s): Team Spirit / Achievement

Most projects use these, and this is nothing new.  But you can spend the same amount of money and get dramatically different results.  How?


AVERAGE PROJECT: Project polo shirts are given out to team members/workers. It builds a team and increases esprit de corps.


MOTIVATED PROJECT: The same number of polos are purchased, but only handed out to a few people that you recognize at a project meeting in the office or the field.  The difference is how the game is played. In order to get a shirt, you have to find a way to reduce cost, improve productivity, shorten project schedule or improve quality. After you pass out the first shirts and recognize thestaff, after the meeting ends you have 100 people looking for ways to reduce cost and improve performance.  They are all going to get shirts eventually, but you will have people looking for and finding ways to improve your project performance/success. People find what they are focused on.

This option costs the same amount of money, but the results are dramatically different simply by the way the game is played and how it is implemented.


Tip # 2: How a $40 Buck knife can change the mindset.


Motivator(s): Achievement / Recognition

I had Buck knives engraved with the project logo and had them ready to pass out to reward achievement. The game was you had to complete your task safely and meet the scope-budget-schedule. If you were a technician with a one day job or a welder on the job for the duration you were presented the award when you completed your task.  How did this save money?  It costs the project $200 per worker to drug test. We could prevent/reduce attrition by playing this game and saving not only drug testing money but also not constantly having to retrain workers and fight the learning curve. Other projects in the area had a 10% attrition rate and workers were hard to attract and retain. Fluor Daniel sent several VP’s to the work site to find out what kind of Club Med we were running since our attrition rate was extremely low. Our project had a base load of 100 workers and a one year schedule.


Tip # 3: Paid Days Off

Motivator(s): Achievement / Recognition

During the project, we had several critical milestones that were MUST DO’s.  Paid overtime is extremely expensive but given a group of highly motivated employees the milestones can be met.  I offered two paid days off if we met the target date.  I had to use this tip several times during the project and was successful each time without overtime.  If you want to have significant results you have to give significant rewards….Achievement / Recognition.


Tip # 4: Give gift certificates instead of spending money on X-rays and rework.

Motivator(s): Achievement / Recognition

We are required to X-ray a certain percentage of welds by code, but if I can get the welder to weld well and not have any busts, I save on rework, waste, schedule and cost.  I’d tell them if all of their welds pass inspection for the day I’d give them a $100 gift card.  I got a lot of high welding productivity results…every time.


Tip # 5: Take an interest in the work they are doing and complement them.

Motivator(s): Recognition

If the client doesn’t understand or appreciate a job well done, why should the worker?  I am not an electrical engineer, but I remember visiting with an electrical contractor who was reading somedrawings and using some tools and jigs to make certain that the conduit spacing and mechanical workmanship looked great.  I took an interest in what he was doing, learned a few things, complimentedhim, and left him feeling that someone appreciated the job and craftsmanship he was putting into his work.


Tip # 6: Remember, “People may never remember what you said, but they will always remember how you made them feel.”

Motivator(s): Recognition


Tip # 7: Build a Reputation of Delivering Services of Unmatched Value

Motivator(s): Relationship with Supervisors and Peers / Achievement

I learned this from a Fluor project manager.  We would meet every month to discuss where we were and where we were going.  He had the standard sets of project graphs and metrics, but with a few twists.  He never would drop off the report for me to read.  He always took me through the report to show me the added value. He never assumed I would read, decipher or understand what value was being delivered.  He showed the Achievement and Results.  Fluor Daniel had a motto at the time: “Delivering Engineering Services of Unmatched Value”…and they delivered.


Tip # 8: Reward Safe Working Performance.

Motivator(s): Achievement / Recognition

The game was that I would personally cook steak for everyone once a month if there were no lost time or first aid accidents…  I had the privilege of serving steak every month for a year.  The cost savings are enormous.  As a side note, you need to start cooking at 9 am for a party of 100 hungry craftsmen.


Tip # 9: Habitability

Motivator(s): Work Conditions

Give them a safe, warm, convenient, comfortable place to eat or take a break.  Require your contractors to provide employees with clean, well maintained, professional coveralls and PPE.  It’s a statement of professionalism and craftsmanship. Below is a sign at the entrance to a commercial construction site in Katy, Texas.  The local staff keep a “Cuss Jar” to eliminate or reduce profanity, and tobacco use.  They donated the fines to charity at the end of the year and had the team photographed for the local paper making a nice donation.


Figure 2. Set Expectations High


Setting high expectations and a professional working environment yields the following results:

-Safer workplace

-More productive workplace

-Increased professionalism and respect

As one engineer told me, “I have never regretted paying for quality”.

Figure 3. Remember to Supercharge your Project [2]


SUMMARY:

A motivation mindset generates successful results.  Remember to apply Herzberg’s principles [1] to your next project.  Supercharge, turbocharge and motivate your staff!

To learn more about similar cases and how to minimize operational problems, we suggest attending ourFPM2 (Project Management in Upstream Development Projects)FPM62 (Advanced Project Management)G4 (Gas Conditioning and Processing), G5 (Advanced Applications in Gas Processing),PF3 (Concept Selection and Specification of Production Facilities in Field Development Projects) andPF49 (Troubleshooting Oil & Gas Processing Facilities) courses.

PetroSkills offers consulting expertise on this subject and many others. For more information about these services, visit our website at http://petroskills.com/consulting, or email us at consulting@PetroSkills.com.

Written by: James F. Langer, P.E.


Sign up to receive Tip of the Month email updates!


References:

1. Herzberg, F, “One More Time, How do you Motivate Employees?, Harvard Business Review, Best of HBR, Reprint RO301F, Jan. 2003.

2. Chapman, A. free resource from https://www.businessballs.com/, 2003

Comments are closed.

The Importance of Specification Breaks

Specification breaks or “Spec Breaks” are extremely important, and are not normally taught in college. They are noted on Piping and Instrumentation Diagrams (P&ID’s) and indicate where a specification change has occurred on piping with regards to Flange Rating, Material, or insulation.  They are extremely important in Hazard and Operability Reviews (HAZOP’s) when reviewing relief valve settings and the hazards introduced by creating overpressure situations by opening and closing valves downstream from a high pressure source.


SAFETY MOMENT:

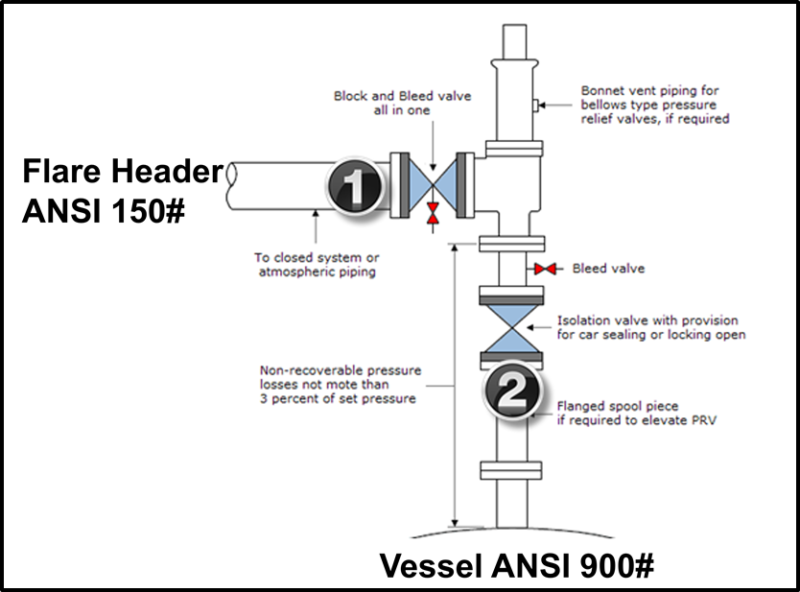
You are working in a gas plant and an upset condition occurs.  It’s 3 AM and cold.  The flare is going off, alarms are sounding, lights are flashing, and your adrenaline is pumping.  The operators correct the situation, and the system returns back to normal.  However; a relief valve (Figure 1) on a high pressure ANSI 900#sSeparator failed to reseat and is leaking a lot of gas to flare.  You’re asked to line-up the stand-by relief valve, and then isolate the leaking valve so that it can be sent in for repairs. Table 1 presents the portion of ANSI class rating.

Table 1 – Flange Pressure, Temperature Rating

Question: Do you close VALVE #1 or VALVE #2 first, or does it matter?

Figure 1. Relief Valve Block Closing Sequence 
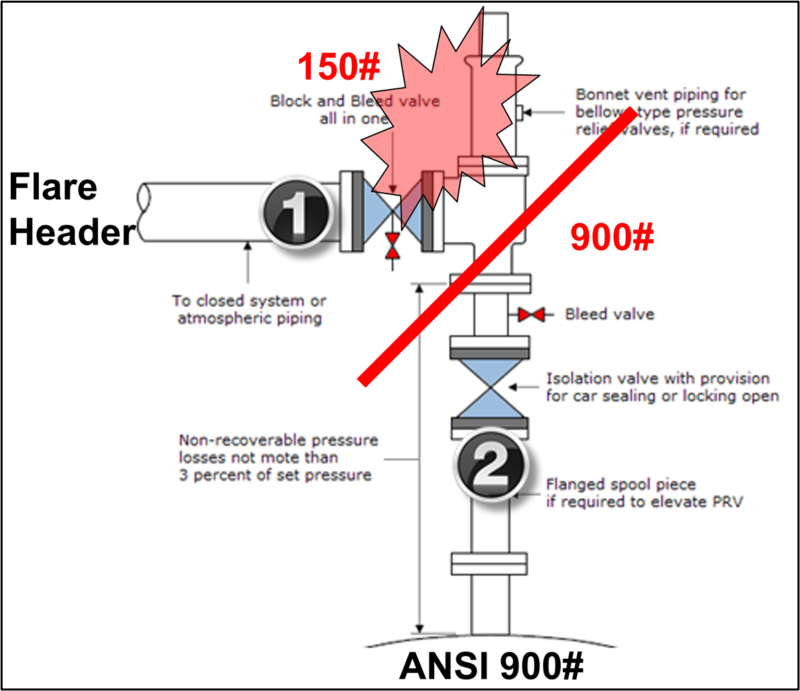
Answer: As seen in Figure 2, you should close VALVE #2 first.  It isolates the high pressure gas from the relief valve.  What many people do not know is that the relief valve has a spec break across the valve.  The downstream flanges are only rated for 150#.  If you mistakenly closed Valve #1 a loss of containment would probably have occurred with serious injury.  In a recent class, approximately 50% of students answered this question incorrectly. This design exists all over our hydrocarbon industry.

Figure 2. Valve Closing Sequence Answer

Can your operators and engineers answer this question correctly?  It may be a great topic for your next safety moment/tailgate safety meeting.

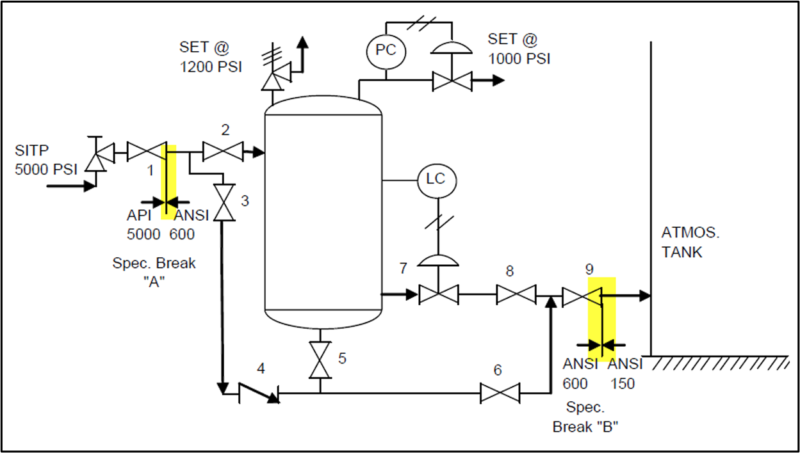
Another source to review is API 14C [1].  Spec breaks are highlighted in Figure 3. (API 5000 to ANSI 600#; and ANSI 600# to ANSI 150#).  One example is discussed below:

The well flows into the system at 5,000 psi and its pressure is reduced by a fixed choke.  The vessel is operated at 1,000 psi and is protected by a relief valve set at 1200 psi.  The vessel has a manual drain valve #5 that is closed.  The level is maintained by a level control valve and a bypass exists around the separator for maintenance.

Figure 3. Specification Breaks Example: What’s Wrong?

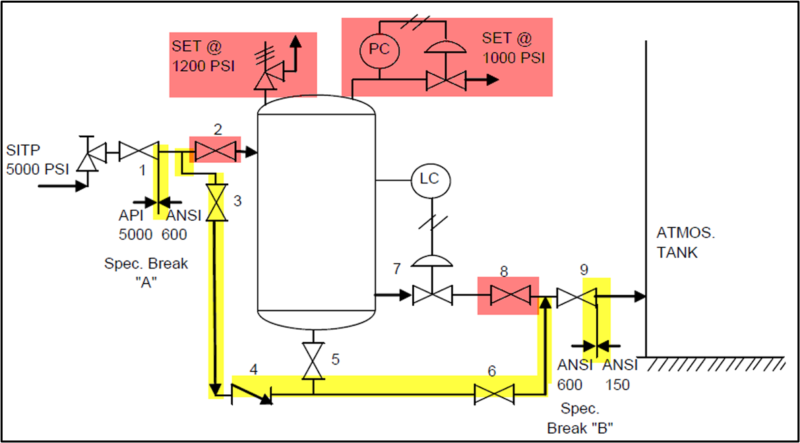
Figure 4. Spec Break Error

In Figure 4 if you close red highlighted valves 2 and 8 then the yellow highlighted piping system is isolated from the relief valve and is currently unprotected from overpressure from the well with a shut-in tubing pressure of 5,000 psi if either of the following valves are closed #3, #6, #9, or the check valve 4 is plugged. If any of these valves are closed the high pressure source will equalize across the choke causing a loss of containment in the downstream piping which is blocked from the relief valve.

If Valve #2 and Valve #8 are closed, and the others are open, then the atmospheric tank will be catastrophically destroyed.

In order to find “spec break busts” and design errors, start at the highest pressure source and then open and close downstream valves to check that each piping component is protected by a relief valve.

For example, by performing simulation, start with the shut-in tubing pressure of 5,000 psi.  Close the next downstream valve which is the choke.  The upstream piping and closed choke must be rated to 5,000 psi. There is no issue since the spec break is the downstream flange of valve 1.  All piping and components upstream of this break are rated to API 5,000.  Next open the choke, open valve 1, close valve 2 and valve 3.  The piping segment is not protected by a relief valve and is only rated to an ANSI 600 # system.  This piping segment will fail and cause a lack of containment.  A solution would be to eliminate valve 2 or provide a PSV upstream of valve 2.

To learn more about similar cases and how to minimize operational problems, we suggest attending ourPS4 (Process Safety Engineering)G4 (Gas Conditioning and Processing), G5 (Advanced Applications in Gas Processing, PF3 (Concept Selection and Specification of Production Facilities in Field Development Projects) and PF49 (Troubleshooting Oil & Gas Processing Facilities) courses.

PetroSkills | John M. Campbell offers consulting expertise on this subject and many others. For more information about these services, visit our website at http://petroskills.com/consulting, or email us at consulting@PetroSkills.com.

By: James F Langer, P.E.

Sign up to receive Tip of the Month email updates!


References

  1. API 14C, Recommended Practice for the Analysis, Design, Installation, and Testing of Basic Safety Systems for Offshore Platforms, 30 CFR 250.1628(c), American Petroleum Institute, 2001

3 responses to “The Importance of Specification Breaks”

  1. BENABED Lazreg says:

    Hi,
    Concerning the closing sequence of the safety relief valve i think we should close only the valve #2 and keep valve #1 opened to avoid a pressure build up in case the valve #2 is leaking.

    Regards

    • James Langer says:

      The system is designed using two isolation valves to allow removal of the PSV for repair.

      But I like the way you are THINKING!

      You should have a procedure for the Operators to check the bleed valve to see if Valve #2 is leaking. If it is, you are correct that you would not want to close Valve #1 if Valve #2 is leaking and you were not removing the leaking PSV for an extended period of time. In fact the procedure should be to open the bleed valve and leave it open when the PSV is blocked in. Do your Operators have a procedure for this, and understand this? If not, help your team out and write one…you may save a life or the Asset. Use it as a safety moment with Engineers & Operations. What went Wrong?

      Thanks for taking the time to post your thoughts.

      Let me know if you have any questions.

      • Donny Sanjaya says:

        Hi James,
        I think what he means is during normal operation, for redundant (2×100%) PSVs, we only need to lock closed Valve #2 (Upstream of PSV) and kept lock opened Valve #1 (Downstream of PSV) for stand by PSV, while for the duty PSV both valves are lock opened.

        This is the common configuration use in the plant. And we do have procedure or requirement for lock open or lock close valves around PSV.

        While this TOTM is explaining the sequence of isolating the valves for example if we want to remove the PSV for re-testing or inspection.

        Regards,
        Donny

Impact of CO2 on Natural Gas Density

Due to the importance of CO2 injection for enhanced oil recovery and the increasing interest in CO2capture and sequestration, this study was undertaken to prepare simple charts for accurately estimating the density for hydrocarbon systems containing nil to 100% CO2.


The September 2008 Tip of the Month (TOTM) [1] evaluated the accuracy of Katz [2] and Wichert-Aziz [3] shortcut methods for predicting sour and acid gas density. The tip demonstrated that for binary mixtures of CH4 and CO2, the Wichert-Aziz method gives a more accurate result for CO2 content of between 10 and90 mole percent.


The October 2008 TOTM [4] evaluated the accuracy of density calculations using two process simulation software packages, NIST REFPROP program [5], the GERG-2004 equation of state [6], and AGA 8 method [7] (in addition to the above shortcut methods) against experimental data. An experimental database was used for the basis of comparison. The sources of experimental data were GPA RR-138 [8] and GPA RR 68 [9]. Table 1 of the October TOTM indicated that REFPROP and GERG 2004 give equally the best results.


In continuing the September and October 2008 TOTMs, this study was undertaken to prepare simple charts for accurate estimation of the density of hydrocarbon systems containing nil to 100% CO2. The charts present density of CO2 + light hydrocarbons mixtures as a function of pressure and  CO2concentration for four isotherms of -50 °C, 0 °C, 50 °C, and 100 °C (-58 °F, 32 °F, 122 °F, 212 °F). The pressure range was from 0.5 MPa to 30 MPa (72.5 psia to 4350 psia) and the CO2 concentrations range was from 0 to 100 mole % (0, 10, 30, 50, 70, 90, 100 mole%). Table 1 presents the composition of systems studied. The default equations in REFPROP are used to calculate the phase boundaries and densities [5].


Table 1. Composition of CO2 + light hydrocarbons systems


The performance of REFPROP program extracted from Table 1 of the October 2008 TOTM [4] is presented in Table 2. This table indicates that the average absolute percent error (AAPE) and average percent error (APE) are 0.46 and 0.23, respectively. Due to the high accuracy of REFPROP program, this TOTM will use REFPROP to calculate the density of CO2 + light hydrocarbon systems.


Table 2. Summary of error analysis for the binary system of CH4 + CO2 density prediction by REFPROP program


We replotted the experimental density data reported in the GPA RR-138 [8] and GPA RR 68 [9] to demonstrate the accuracy of REFPROP program. The results of this evaluation are shown in Figures 1A through 5A (Appendix A), for CO2 content of 9.83 to 100 mole percent and the temperature and pressure ranges of Table 2…


Next, we plotted the calculated density by REFPROP as a function of pressure and CO2 content for four temperatures in Figures 1 through 4.


Figure 1. Variation of density with pressure and CO2 concentration at -50 °C (-58 °F)


Figure 2. Variation of density with pressure and CO2 concentration at 0 °C (32 °F)


According to REFPROP the dashed lines in Figure 1 present the two-phase region for all CO2concentrations except for the case of 100 mole % which is in the gas phase. All solid lines present the liquid phase region. REFPROP indicated that in Figure 2:

►For CO2 concentrations of 0, 10, and 30 mole %, the dashed lines present gas phase for pressures up to 2.5 MPa (362.5 psia) and two-phase for pressures more than 2.5 MPa (362.5 psia). The solid lines present the supercritical region.

►For CO2 concentrations of 50, 70, and 90 mole %, the dashed lines present gas phase for pressures up to 2 MPa (290 psia) and two-phase for pressures more than 2 MPa (290 psia). The solid lines present the liquid phase.

►For CO2 concentration of 100 mole %, the dashed line presents gas phase. The solid line presents the liquid phase.

REFPROP also indicated that all dashed lines in Figures 3 and 4 present the gas phase region and all solid lines present the supercritical region.


Figure 3. Variation of density with pressure and CO 2 concentration at 50 °C (122 °F)


Figure 4. Variation of density with pressure and CO2 concentration at 100 °C (212 °F)


SUMMARY

Based on the work done in this TOTM, the following can be concluded:

►CO2 concentration has a great impact on the mixture density. As CO2 concentration increases the mixture density increases.

►REFPROP is relatively accurate for density calculations of pure CO2 and mixtures of light hydrocarbons and CO2 (Table 2 and Figures 1A-5A).

►Simple density charts are presented for accurate estimation of a natural gas (relative density 0.65) as a function of pressure and CO2 concentration for four temperatures (Figures 1-4). These charts are composition specific (Table 2), similar charts should be developed for different compositions.

►Knowledge of phase boundaries and behavior is essential for density calculation.

To learn more about similar cases and how to minimize operational problems, we suggest attending ourG4 (Gas Conditioning and Processing), G5 (Practical Computer Simulation Applications in Gas Processing), and G6 (Gas Treating and Sulfur Recovery) courses.

PetroSkills offers consulting expertise on this subject and many others. For more information about these services, visit our website at http://petroskills.com/consulting, or email us at consulting@PetroSkills.com.

By: Dr. Mahmood Moshfeghian

Sign up for Tip of the Month email updates!


REFERENCES

  1. Moshfeghian, M., “How good are the shortcut methods for sour gas density calculations?,” PetroSkills tip of the month, Sep 2008
  2. Standing, M.B. and Katz, D.L.; “Density of Natural gas gases,” AIME Trans., 146, 140-49 (1942)
  3. Wichert, E. and Aziz, K., Hydr. Proc., p. 119 (May 1972).
  4. Moshfeghian, M., “How good are the detailed methods for sour gas density calculations?,” PetroSkills tip of the month, Oct 2008
  5. Lemmon, E.W., Huber, M.L., McLinden, M.O.  NIST Standard Reference Database 23:  Reference Fluid Thermodynamic and Transport Properties-REFPROP, Version 9.1, National Institute of Standards and Technology, Standard Reference Data Program, Gaithersburg, 2013.
  6. Kunz, O., Klimeck, R., Wagner, W., and Jaeschke, M.  “The GERG-2004 Wide-Range Equation of State for Natural Gases and Other Mixtures,” GERG Technical Monograph 15 (2007)
  7. K. E. Starling, et al., “Self-Consistent Correlation of Thermodynamic and Transport Properties,” GRI/AGA Project No. Br-1111; OU-ORA Project No. 2036 156-716. Report: GR/AGA/BR-1111/77-36.
  8. Hwang, C-A., Duarte-Garza, H., Eubank, P. T., Holste, J. C. Hall, K. R., Gammon, B. E.,  March, K. N., “Thermodynamic Properties of CO2 + CH4 Mixtures,” GPA RR-138, Gas Processors Association, Tulsa, OK, June 1995
  9. Hall, K. R., Eubank, P. T., Holste, J., Marsh, K.N., “Properties of C02-Rich Mixtures Literature Search and Pure CO2 Data, Phase I,” GPA RR-68, A Joint Research Report by Gas Processor Association and the Gas Research Institute, Gas Processors Association, Tulsa, OK, June 1985


APPENDIX

Figure 1A. REFPROP (solid line) and experimental (symbols) [8] density for binary mixture CH+ CO2 (9.93 mole% CO2)


Figure 2A. REFPROP (solid line) and experimental (symbols) [8]  density for binary mixture CH+ CO2 (29.11 mole% CO2)


Figure 3A. REFPROP (solid line) and experimental (symbols) [8] density for binary mixture CH+ CO2 (66.82 mole% CO 2)


Figure 4A. REFPROP (solid line) and experimental (symbols) [8] density for binary mixture CH+ CO2 (90.11 mole% CO2)

Figure 5A. REFPROP (solid line) and experimental (symbols) [9] density for 100 mole% CO 2

2 responses to “Impact of CO2 on Natural Gas Density”

  1. Carlo Stenali says:

    GERG 2008 / AGA 2017 gives good results, extended Peng Robinson forms (for example Prode PRX) can also give quite accurate results for CO2+C1, anyway you should test CO2+H2S+C1 or CO2+H2S+N2+C1 … etc.

  2. Natural Gas density to be calculated by the way of finding accurate result. The shortcut method is given for your post. Experimental results and presenting calculation also for me. Thank you. The concentration of calculation is very important. The equations are used for finding with accuracy. Each and every data are containing real and presenting table also. System study is used for calculation of temperature and pressure. It is also containing some of range for table

Multiphase Flow Measurement – What is it?

Multiphase flow measurement (MPFM) is accomplished by using a system of devices that reports the volume or mass of oil, water and gas, generally at some standard process condition of temperature and pressure. The various forms of multiphase flow measurement include a three-phase vessel that separates oil water and gas flow streams, or a vessel that separates gas and liquid flow streams and measures the liquid water cut, or newer technology that replaces the vessel with a smaller lighter flow measurement device. This device is called a multiphase flow meter which is sometimes given the acronym “MPFM.”


The existing forms of multiphase flow measurement typically require a pressure vessel that occupies a large volume, has a high wet weight, has a large footprint and costs a relatively large amount of money. Furthermore, vessels require periodic maintenance of cleaning, painting, device calibration, divert valve leakage testing and control valve maintenance. The newer MPFM technologies may weigh in the range of 2000 to 4000 pounds (907 1814 kg), have a footprint of less than 30 ft² (2.8 m2) and a height of generally no more than 9 feet (2.7 m). If the newer MPFM technology is shown to be equivalent to separation measurement then a weight and space improvement can be realized. Depending on the pricing and trending capability of the new technology it would be feasible to have a MPFM on each well. The pricing of these MPFM’s is highly dependent on the size and range of the meter, the uncertainty, whether it uses a gamma radiation source and other items. The one common item among all MPFM’s is they have to be “calibrated (verified in place)”.


For allocation measurement using a vessel the test duration may be anywhere from 8 to 24 hours. Some of that time is to allow operations to perform other tasks while the tests are proceeding. Multiphase meters require no retention time during operation,  typically measuring instantaneously every second which provides a flowing profile over time that is not available using a vessel-type flow measurement system. Slugging and other well performance patterns are readily seen in the output of a MPFM.


These MPFMs determine the instantaneous, incremental gas volume fraction, the water cut and mass or volume rates many times per second. Water cut measurement requires knowledge of oil volume, water volume and salinity plus oil and water density. All MPFM vendors have their own special purpose instrumentation along with off-the-shelf process instrumentation like temperature, pressure and differential pressure instruments. All vendors also have their own empirically derived equations that are solved using fast computers. Some vendors use gamma radiation devices for density and water cut, some vendors use a specialized 0 to 100% water cut meter, some vendors use a venturi for rate, some vendors use mathematical cross-correlation for rate. Some vendors partially separate some of the gas from the flow stream. This would be called a partial separation multiphase flow meter.


What are the issues with multiphase measurement besides an infinite number of instantaneous flow regime scenarios and the fact that most systems must be site calibrated?


The main issues with multi-phase measurement are the multiple and varied fluid properties and flow regime present at the point of measurement. The flow regime is a function of how much oil, water and gas is flowing either vertically, horizontally or slanted, the water salinity, water cut (WC), the oil, water and gas densities, the fluid viscosities, particle sizes, surface tensions and others with flow regimes changing in fractions of seconds. Existing, externally mounted instrumentation such as pressure, temperature, differential pressure, permittivity, and conductivity did not provide all the low uncertainty, instantaneous data required to measure the three phases at low average uncertainties over all conditions of velocity, water cut and gas volume fraction.. Instrumentation and software development is ongoing and improving and provides lowered MPFM uncertainties in larger ranges.


One of the ways to represent the multiphase measurement task is to plot the multiphase measurement requirements on a chart of actual superficial gas rate versus actual superficial liquid rate overlaid with lines of constant GVF (Gas Volume Fraction). These graphs may be on either Cartesian or log-log coordinates.  Actual testing of multiphase meters in multiple, precise flow loops in the world has shown that for a given type of multiphase meter uncertainty profiles depend on the meter’s technology and the fluid types and rates. Water cut is represented as the third dimension or z-axis to the gas and liquid coordinates.


Actual testing of multiphase meters has shown that fluid rate uncertainties are a function of water cut, salinity, density and GVF. WC uncertainty tends to increase as the water cut falls below 3 to 6% or is greater than 95%. WC uncertainty may also tend to increase in the range where liquid changes from oil continuous to water continuous phase. Both issues are affected by GVF at the point of measurement.


One common, good characteristic of multiphase meters is repeatability per well but each well might be different. Even though rate uncertainties may be high for a given flow stream, repeatability may be 1% or less. In fact, some meter vendors specify repeatability over uncertainty allowing MPFM data to be very trendable.


Older, more mature production tends to have lower gas volume fractions (in the range of 20 – 50%) which is generally easier to measure with an MPFM. However, MPFM’s are relatively expensive (but costs are coming down); consequently, less complex equipment and technology is often used. Examples are Accu-flo and the GLCC (Gas-Liquid Cylindrical Cyclone compact separator) based systems. These systems separate gas and liquid then use single phase technologies to measure oil, water and gas.


Some secondary production methods such as gas lift causes the produced gas volume fraction to be in the range of 85 to 95% which falls more or less in the general area of “slugging” flow, which in the past has been problematic for full range MPFM’s. “Wet gas” production is normally defined as having a gas volume fraction greater than 95% which with today’s MPFM technology has spawned either meters designed for this range or options for a more traditional full range MPFM with high end options.


Establishing MPFM Requirements:

Let’s cover the ranges of flow measurement requirements that may be found in oil and gas production which may be illustrated by a GVF map. The map has actual gas rates along the horizontal and actual liquid rates along the vertical. If plotted as a rectangular plot, Figures 1 and 2, the lines of constant GVF run upper right to lower left with the lowest GVF on the bottom and the highest on the top. If plotted on log-log coordinates, Figure 3, the constant GVF lines run in parallel increasing left to right. Also, notice for the log-log plot that as GVF increases the constant GVF lines move further apart.


The variation of fluid properties such as viscosity, salinity, particle size and others from well to well helps to explain why an MPFM may work well on one well and not on another even though the rates are very similar.


Figure 1. Variation of actual liquid rate with actual gas rate and gas volume fraction (full GVF range)


Figure 2. Variation of actual liquid rate with actual gas rate and gas volume fraction (high GVF range)


Figure 3. Variation of actual liquid rate with actual gas rate and gas volume fraction (log scale)


General MPFM Measurement Process:

Resolving a multiphase flow stream into oil, water and gas depends on gas density, oil and water density,watercut, conductivity, salinity, capacitance and particle size which may be measurable and effects of flowing viscosity, electrostatic attraction, acid gasses and flow orientation which typically are not measurable.


For most MPFMs it is required to determine the GVF followed by the liquid density or watercut followed by the mass or volumetric rate of each fluid. These iterative, proprietary, calculations are completed at about 30-40 per second on fluid moving anywhere from about 1 m/s to > 30 m/s (3.3 ft/sec to > 98 ft/sec). It is very difficult to describe turndown or rangeability of MPFM systems due to the multiple interactions but may be expressed in terms of each phase.


1. Flowing total fluid density:

Single energy gamma densitometer or a dual acting venturi provides instantaneous flowing fluid density as a function of undetermined gas volume fraction and water cut.


The instantaneous liquid density is highly dependent on instantaneous oil mass or volume rate and density plus the instantaneous mass or volume rate of water and water’s salinity at the instant of measurement.


2. Water-cut is a function of electrical properties as well as water-oil volumes and oil water continuous phase condition:


The measurement of WC uses the electrical property of oil and water called permittivity. There is about a 30:1 to 40:1 permittivity ratio of water to oil but when the fluid is in the water continuous phase conductivity (resistance) is added which almost always affects the measurement. Watercut becomes an iterative solution. If water cut is missed all other calculations are thrown off. When gas is added to oil-water it decreases the average permittivity making the MPFM report more oil.


Water cut or water liquid ratio (WLR) is the volumetric ratio of water volume to total liquid volume:


3. GVF is gas volume to total fluid volume fraction at process conditions:

It is equal to gas void fraction if there is no “Hold-up” or “Slip” between phases.


4. Gas liquid ratio (GLR) is the ratio of actual gas volume (rate) to total liquid volume (rate):              


5. The homogeneous (no slip) relation between GVF and GLR:

One of the ongoing issues with multiphase measurement is whether the assumption that “Slip” is 0 (all phases are flowing at the same velocity) is valid for all flow regimes. Some vendors are now evaluating the flow stream cross section thousands of times per second using technology such as scanning sonar that infers fluid properties. PVT analysis is also applied or sampled properties are hand loaded. Some blind testing has shown that at least for one MPFM the measured properties did better than the PVT calculated properties. Direct measurement of salinity is showing promise both as an instrument and in helping to reduce the measurement uncertainty.


The multiphase measurement system has to solve for gas volume fraction, watercut and fluid volumetric or mass velocity depending on different methods (Table 1).


Table 1: General methods for measuring multiphase flow variables


New instrumentation in MPFM technology better discern instantaneous oil/water/gas fractions: Here is a summary extracted from thesis by Da Silva [1].

1. Complex permittivity needle probe: This technology can detect the phases of a multiphase flow at its probe tip by simultaneous measurement of the electrical conductivity and permittivity at up to 20 kHz repetition rate.

2. Capacitance wire-mesh sensor: This newly developed technology can obtain two-dimensional images of the phase distribution in pipe cross-section. The sensor can discriminate fluids withdifferent relative permittivity (dielectric constant) values in a multiphase flow and achieve frame frequencies of up to 10,000 frames per second.

3. Planar array sensor: The third sensor can be employed to visualize fluid distributions along the surface of objects and near-wall flows. The planar sensor can be mounted onto the wall of pipes or vessels and thus has a minimal influence on the flow. It can be operated by a conductivity-based as well as permittivity-based electronics at imaging speeds of up to 10,000 frames/s.

All three sensor modalities have been employed in different flow applications which are discussed in Da Silva thesis [1].


Electrical Impedance Methods (Capacitance and Conductance):

Impedance methods have attracted a great deal of interest due to their non-invasive instrumentation and almost instantaneous dynamic response. Electrical impedance methods operate by characterizing the multiphase fluid flowing through a pipe section as an electrical conductor. Either contacting or non-contacting electrodes are employed to quantify the electrical impedance across the pipe diameter of the multiphase flow line thus enabling determination of the capacitance or conductance of the fluid mixture. The frequency of the input signal determines whether the measurement is in the impedance or the capacitance mode. By measuring the electrical impedance across two electrodes, the measured resistance and capacitance can be calculated, Blaney [2].


The technical and economical advantages of MPFMs are behind the increasing number of MPFM field installations worldwide in recent years. In addition, some of the major operators have made multiple orders of up to 40 MFMSs for full-field application. Figure 4a shows the actual trend up to and including 1999 plus a 2000 forecast published in 1997 [3]. Figure 4b presents the regional distribution of MPFM installed during 1994-2004 worldwide [4]. Figure 4c presents the total number of MPFM installed up to 2010 and estimated forecast beyond 2010.  Based on Figure 4c, an extrapolation for the next 5-10 years of MPFM installations suggests that the number of MPFM installation may double from 2010 estimate [4].


Figure 4a. Growth rate of MPFM installations [3].


Figure 4b. Approximate distribution of MPFM installations worldwide.


Figure 4c. MPFM installation and estimated growth forecast [4]


Summary:

In summary, multiphase measurement flowmeters became possible with fast computer processors. Virtually all MPFM devices utilize proprietary software solutions combined with a combination of proprietary and off the shelf instrumentation. Recent blind tests suggests that measuring fluid properties instead of PVT calculated properties provided improved certainty. The final observation is that proving an MPFM after installation may only require calibrating instruments or quite like proving gas orifice meters.

To learn more about similar cases and how to minimize operational problems, we suggest attending ourIC3 (Instrumentation and Controls Fundamentals for Facilities Engineers)G4 (Gas Conditioning and Processing), G5 (Practical Computer Simulation Applications in Gas Processing) and G6 (Gas Treating and Sulfur Recovery) courses.

1 response to “Multiphase Flow Measurement – What is it?”

  1. Sergio Makow says:

    Please include me in the mail distribution regarding new articles.

Optimum Feed Tray Location in an NGL Fractionation Column

A fractionator is a column equipped with trays or packing materials for separating a mixture of components into two or more products, at least one of which will have a controlled composition or vapor pressure. In crude oil or condensate systems, such a fractionator is often called a stabilizer and is an alternative to stage separation. The fractionator is essentially a constant pressure column that uses heat, absorption, and stripping to separate components based on the difference in their boiling points [1].

Fractionation or distillation columns are named based upon the products that they produce overhead, for example, a deethanizer will produce a distillate stream that primarily contains ethane and lighter components such as methane and nitrogen, with a bottoms product of propane and heavier components (C3+). Similarly, a depropanizer will produce a distillate stream that is primarily propane, and the bottoms stream is butane and heavier components (C4+). Chapter 16 of the Gas Conditioning and Processing presents an excellent overview of fractionation and absorption fundamentals [1].

Predicting the optimum feed tray location in the design phase is not easy, particularly if a short-cut calculation is used. Virtually all short-cut calculation methods of estimating feed tray location are based on the assumption of total reflux [1].

This tip of the month (TOTM) will demonstrate how to determine the optimum location of a feed tray in an NGL fractionation or distillation column by a short-cut method and the rigorous method using a process simulator. As an example, we will consider sizing a deethanizer by performing material and energy balances, distillation column short-cut calculations, and rigorous tray-by-tray calculations. Finally, the TOTM will determine the optimum feed tray location by the short-cut and rigorous methods.


Deethanizer Case Study:

Let’s consider a deethanizer column with the feed compositions, flow rate, temperature and pressure presented in Table 1. It is desired to size the deethanizer column:

A. To recover 90 mole percent of propane of the feed in the bottoms product and

B. Ethane to propane mole ratio equal to 2 % in the bottoms product

For understanding the concept, the TOTM will do the sizing in three steps:

1. Material and energy balances

2. Distillation column short-cut method

3. Distillation column rigorous tray-by-tray calculations

All of the above steps can be done by the available tools/operations in a process simulator.  In this TOTM all calculations are performed using UniSim Design [2] with the Peng-Robinson [3] equation of state option. Figure 1 presents the process flow diagram (operations/tools) for the above steps [2].


Table 1. Feed composition and condition


Figure 1. Process flow diagram [2]


Material and Energy Balances:

Let’s choose ethane as the light key (LK) component and propane as the heavy key (HK) component because their separation requirements are specified. Assume that all of the components lighter than the LK component go to top and all of the components heavier than the HK component go to bottom.

Column condenser pressure is normally set based on the cooling media temperature. Typical operating pressure range for a deethanizer is 375–450 psia (2586–3103 kPa) [1]. Since the feed pressure is 435 psia (3000 kPa), assume the column top pressure is 403 psia (2779 kPa) and bottom pressure is 410 psia (2828 kPa).

We can use the “component splitter” tool in the process simulator to perform initial material and energy balances. The “component splitter is shown in the lower part of Figure 1. The split for propane (HK) is specified (90 mole % goes to bottom and remaining 10 mole % to top). The ethane split is unknown but can be determined by trial and error manually or by using the “adjust” or “solver” tool of the process simulator which essentially varies the ethane spilt so the mole ratio of ethane to propane in the bottoms product becomes 2 %. The estimated ethane split of 97 mole % goes to top.

The estimated mole fractions of the LK and HK components in the top and bottoms and the specified values in the feed stream are presented in in Table 2. The “component splitter” also determines the estimates of top and bottoms flow rates, compositions, temperature and the energy requirement.


Table 2. Specified (feed) and estimates of key components compositions


Distillation column short-cut calculation method:

Using the top and bottom column pressures and the key components mole fractions (from Table 2), the short-cut distillation column operation in the process simulator can be used to determine the minimum number of equilibrium (theoretical) trays and the minimum reflux ratio (Reflux rate /Distillate rate), (L/D)min. The process flow diagram for the distillation column short-cut method is presented in the middle of Figure 1.


The estimated minimum number of trays using Fenske’s correlation[1,4] is 6.1 and the minimum reflux ratio using Underwood’s correlation [1,5] is (L/D)min = 0.618. The operating reflux ratio is typically in the range of 1.05–1.25 times (L/D)min [1]. Assuming operating reflux ratio is 1.15 times (L/D)min then the operating reflux ratio is 0.711. For this operating reflux ratio, the program determines the number of equilibrium trays using Gilliland’s Correlation [1,6], the optimum feed tray using Kirkbride’s correlation [1,7], components compositions in the overhead and bottoms products, top and bottoms flow rates, temperatures, and condenser and reboiler duties. Table 3 presents the summary of the short-cut results.


Table 3. Summary of the specified and calculated values from column short-cut method

Predicting the optimum feed tray location in the design phase is not easy, particularly if a shortcut calculation is used. Virtually all the short-cut calculation methods of estimating feed tray location assume total reflux. A convenient empirical correlation by Kirkbride [1,7] is in Equation 1.


(1)

N + M = S          (2)

Where:   N         = number of equilibrium trays above feed tray

M         = number of equilibrium trays below feed tray

B         = bottoms rate, moles

D         = distillate rate, moles

xHKF     = composition of heavy key in the feed

xLKF     = composition of light key in the feed

xLKB     = composition of light key in the bottoms

xHKD    = composition of heavy key in the distillate

S          = Number of equilibrium trays in column


Substituting the corresponding parameter values from Tables 2 and 3 in Equations 1 and 2 results in the values of N and M.


Since N + M = 16.9, N = 5.42 and M = 11.48, the estimated optimum feed tray location matches well with the value reported in Table 3. Approximately 5.42 equilibrium trays will be required above the feed tray and 11.48 equilibrium trays (including reboiler) below.

The actual number of trays in the column can be estimated by dividing equilibrium number of trays by the overall tray efficiency. Typical deethanizer overall tray efficiency is 50–70 % [1]. Assuming an overall tray efficiency of 60%, the actual number of trays will be 16.9/0.6 = 28, which is in the range of typical deethanizer actual number of trays of 25–35 [1].


Distillation column rigorous tray-by-tray calculations:

By performing the short-cut calculations, we have good estimates of different variables for this deethanizer column. For the specified ethane and propane specifications, 17 equilibrium trays (including reboiler) plus a condenser, top and bottom pressure, estimated feed tray location, and an estimate of operating reflux ratio, rigorous computer simulation can be performed. Note that the number of equilibrium trays, the estimate of feed tray location, and the operating reflux rate were determined in the preceding sections.

Because the short-cut method estimated of feed tray location and other variables, we will use tray-by-tray calculations by computer simulation to improve deethanizer sizing and locate a better optimum feed tray location. The deethanizer column tray-by-tray process flow diagram is shown on the top of Figure 1.

The tray-by-tray rigorous simulation results for the conditions provided in this case study are presented in Table 4 and Figure 2. Several feed tray locations are simulated and the one yielding the lowest condenser duty (reboiler duty) is the optimum location. The optimum feed tray location is tray 3 from top (N=3 and M=14 including reboiler).


Table 4. Condenser and reboiler duty vs feed tray location


Figure 2. Condenser and reboiler duties as a function of feed tray location


The column temperature profiles as a function of feed tray location are shown in Figure 3. The optimum feed tray location should result in a smooth temperature profile. Improper feed tray location is usually manifested by a sharp discontinuity in the slope of the temperature profile. Multiple feed nozzles and or a feed preheater are typically used to provide flexibility to adjust to changing feed conditions.


Figure 3. column temperature profile vs feed tray location


Several key design parameters for feed tray location of 3 are presented in Table 5.


Table 5. Summary of key design parameters for feed tray location of 3


Alternatively, a column profile of molar ratio of LK/HK composition with tray number can be plotted. The optimum feed location is determined by matching the molar ratio of LK/HK in the feed to the column profile of LK/HK. This method results in minimizing the reboiler and condenser duties for the distillation column.


Summary:

This TOTM demonstrated how a process simulator can be used to size a deethanizer and determine the optimum feed tray location by minimizing the reboiler and condenser duties. This procedure is equally applicable to other NGL fractionators.

Selection of the proper feed tray location is important in order to optimize the operation of the fractionator. Placing the feed tray too high in the tower can result in excessive condenser duty (reflux ratio) to meet distillate product specification. Too low a feed location may result in excessive reboiler heat to meet bottom product specification.

Because short-cut methods provide a rough estimate of feed tray location, a rigorous tray-by-tray simulation program should be used to determine the optimum location of the feed tray by minimizing the condenser/reboiler duties.

Multiple feed nozzles and or a feed preheater are typically used to provide flexibility to adjust to changing feed conditions.

To learn more about similar cases and how to minimize operational problems, we suggest attending our G4 (Gas Conditioning and Processing), G5 (Practical Computer Simulation Applications in Gas Processing), and G6 (Gas Treating and Sulfur Recovery) courses.

PetroSkills offers consulting expertise on this subject and many others. For more information about these services, visit our website at http://petroskills.com/consulting, or email us at consulting@PetroSkills.com.

By: Dr. Mahmood Moshfeghian

Sign up to receive Tip of the Month emails!


References

  • Kirkbride, C. G., Petroleum Refiner 23(9), 321, 1944.
  • Gilliland, E. R., Multicomponent Rectification: estimation of number of theoretical plates as a function of reflux ratio, Ind. Eng. Chem., 32, 1220-1223. 1940.
  • Underwood, A. J. V, The theory and practice of testing stills. Trans. Inst. Chem. Eng., 10, 112-158, 1932.
  • Fenske, M. R. Fractionation of straight-run Pennsylvania gasoline, Ind. Eng. Chem.; 24 482-485.1932.
  • Peng, D.Y. and D. B. Robinson, Ind. Eng. Chem. Fundam. 15, 59-64, 1976.
  • UniSim Design R443, Build 19153, Honeywell International Inc., 2017.
  • Campbell, J.M., Gas Conditioning and Processing, Volume 2: The Equipment Modules, 9th Edition, 2nd Printing, Editors Hubbard, R. and Snow–McGregor, K., Campbell Petroleum Series, Norman, Oklahoma, 2014

1 response to “Optimum Feed Tray Location in an NGL Fractionation Column”

  1. Oljo OjOl@facebook says:

    Can you proffer a design concept to the descriptive process below:

    Building on the research paper “Crack it! Energy from a Fossil Fuel without carbon dioxide” published November 16th, 2015 jointly by the Institute of Advanced Sustainability Studies (IASS) and Karlsruhe Institute of Technology (KIT) Germany, Al’Maze Consulting has successfully been able to design a solution prototype to extract Hydrogen and Carbon from Methane at 100% Conversion Rate, as well at Least Cost Possible.

    The solution prototype utilised Biomass as feedInputStock (human waste, animal waste, agricultural waste) collated in a central processing unit to generate Biogas (Methane) in the absence of Oxygen.

    Methane is subsequently cracked with Molten Tin as Separative Catalyst at temperature of 1200°C using energy from Sun.
    design solution prototype. chemistry

    CH4 + 74.85kJ/mol —-> C + 2H2. an endothermic reaction

    apply following in design

    – molten Tin at 1200°C

    – molten Tin serves as separative catalyst

    – drag force mechanics-physics applied in gravitational distances

    – optics lens to convert solarEnergy to heatEnergy to achieve 1200°C

    – pass methane to molten Tin in a perpendicularly fabricated cylinder tube

    – the design ensures continuous flow of molten Tin, Carbon and Hydrogen without clogging

    – hydrogen burns out of methane

    – it is harvested upward because its gas and its very light

    – carbon deposit on the surface of molten Tin

    – carbon is lighter than Tin on the periodic table

    – convert inputHeat from Sun in Output to reusable

    further byProducts in design, and use

    – Nitrogen from biomass compost for Organic Farming

    – Black Carbon for water-holding in Soil

Ideal Water Content Correlation for Sweet Natural Gas

The analysis of Figures 1 through 3 indicates that the for pressures up to 100 psia (690 kPa) the Raoult’s law water content deviations from real state water content are within about +4% and -4%.  The water vapor content of natural gases in equilibrium with water is commonly estimated from Figure 6.1 of Campbell book [1] or Figure 20.4 of Gas Processors and Suppliers Association [2]. In the October, November, December 2007, February 2014 and September 2014 Tips of the Month (TOTM), we studied in detail the water phase behaviors of sweet and sour natural gases and acid gas systems. We presented several correlations and evaluated the accuracy of different methods for estimating the water content of sweet natural gas, sour natural gas, and acid gas systems.


In this TOTM, we will evaluate pressure and temperature applicability ranges and accuracy of the ideal water content correlation for sweet natural gases. In addition, the performance of the ideal water content correlations will be compared with the equation of state based rigorous calculation methods.


Equilibrium Water Content at Low Pressures

Assuming vapor phase is an ideal gas and liquid phase is an ideal solution, the equality of water fugacities at equilibrium simplifies to the Raoult’s law.

(1)

Where:

yw  = mole fraction water in the vapor phase

PV = vapor pressure of water at system temperature

P  = system pressure

xw = mol fraction water in the liquid water phase


The liquid mole fraction can be taken as xw = 1.0 because of the low solubility of the hydrocarbon phase in the aqueous phase and to cover cases where no liquid hydrocarbon is present – just vapor + liquid water.  Thus, for a known pressure and water vapor pressure the mole fraction water in the vapor phase is found from Equation 1.

Under ideal conditions, the mole fraction of water in the gas phase can be estimated by dividing water vapor pressure, PV, at the specified temperature, T, by the system pressure, P. The vapor pressure of pure water, from 0 to 360 °C, (32 to 680 °F) can be calculated by the following correlation [3].

(2)


Where:

τ = 1 – (T/TC)


The critical temperature, TC = 647.096 K (1164.77 °R)  and critical pressure, PC = 22064 kPa, (3199.3 psia) T in K (°R), and PV in kPa (psia), and

a1 = −7.85951783

a2 = 1.84408259

a3 = −11.7866497

a4 = 22.6807411

a5 = −15.9618719

a6 = 1.80122502


Knowing one kmole of water = 18 kg (lbmole=18 lbm) and one kmole of gases occupy 23.64 Sm3 at standard condition of 15 °C  and 101.3 kPa (one lbmole of gases occupy 379.5 SCF at standard condition of 60 °F  and 14.7 psia), the ideal water content is calculated by:

(3)


Bukacek Correlation

Bukacek [4] suggested a relatively simple correlation for the water content of lean sweet gases as follows:

(4)


(5)


where T is in °F and PV and P are absolute pressures in psia (kPa).


This correlation is reported to be accurate for temperatures between 60 and 460°F (15.5 and 238°C) and for pressure from 15 to 10,000 psia (0.105 to 69.97 MPa). The pair of equations in this correlation is simple in appearance. The added complexity that is missing is that it requires an accurate estimate of the vapor pressure of pure water. In this study, we have used equation 2 for water vapor pressure.


Evaluation of the Raoult’s Law (Ideal) Water Content

The performance of the Raoult’s law for estimating water content of sweet natural gases was evaluated against Bukacek correlation [4], GCAP software [5] and two simulation programs. The water content of GCAP is based on Figure 6.1 of Campbell book [1]. The SRK EOS (Soave-Redlich-Kwong equation of state) with its default binary interaction parameters was used in both simulation programs. The composition of gases needed for simulation study are shown in Table 1. The Raoult’s law, GCAP program and Bukacek correlation are independent of gas composition.


In simulators, there are several options to predict the equilibrium water content of a gas stream which may give different answers. In this study, the mole fraction of water in the desired stream is multiplied 47430 to get lbm/MMscf (or 761420 to get kg/106 Sm3).


Figure 1 through 5 present the percent deviations of water content estimated by Raoult’s law from GCAP program, and two simulation programs (Sim B and Sim C). In each figure, the percent deviations of Raoult’s law water content from those predicted by GCAP, Sim B and Sim C are presented on the vertical axis. The Raoult’s law and GCAP methods are independent of composition while Sim B and Sim C are composition dependent.

The pressure values are 25, 50, 100, 200, and 300 psia (172, 344, 690 1379, and 2069 kPa); respectively. For each pressure, the results for four isotherms of 40, 80, 120, and 160 °F (4.4, 26.7, 48.9, 71.1 °C) are presented.

Figure 1 indicates that at low pressure of 25 psia (172 kPa), the deviations of Raoult’s law water content from the other three methods are small and within -4 to +1%, span of 5%.

Figure 2 indicates that at low pressure of 50 psia (345 kPa), the deviations of Raoult’s law water content from the other three methods are small and within -3 to +2%, span of 5%.

Figure 3 indicates that at low pressure of 100 psia (690 kPa), the deviations of Raoult’s law water content from the other three methods are small and within -1 to +4%, span of 5%.


Fig 1. Water content by Raoult’s law vs GCAP and two simulators at 25 psia (172 kPa)


Fig 2. Water content by Raoult’s law vs GCAP and two simulators at 50 psia (345 kPa)


Fig 3. Water content by Raoult’s law vs GCAP and two simulators at 100 psia (690 kPa)


The analysis of Figures 1 through 3 indicates that the for pressures up to 100 psia (690 kPa) the Raoult’s law water content deviations from real state water content are within about +4% and -4%.

Figure 4 indicates that at the higher pressure of 200 psia (1379 kPa), the deviations of Raoult’s law water content from the other three methods are higher and within 0 to +9%, span of 9%. This figure also indicates that the Raoult’s law percent deviation from GCAP is the largest while simulator B gives lower values of deviations.

Figure 5 indicates that at the higher pressure of 300 psia (2069 kPa), the deviations of Raoult’s law water content from the other three methods are within +5 to +14%, span of 9%. This figure also indicates that the Raoult’s law percent deviations from GCAP is the largest while simulator B gives lower values of deviations.

In general, for a combination of pressure and temperature which results in less dense gas (low pressure and high temperature), there are fewer deviations of Raoult’s law from simulator results that are based on an EOS (equation of state).

Table 2 presents the absolute percent deviations and the overall average absolute percent deviations of Raoult’s law from GCAP, Sim B, Sim C, and Bukacek methods for 140 evaluated points. Note for each temperature, four gases with compositions shown in Table 1 were evaluated. Table 2 indicates that Raoult’s law results have the least deviation from Bukacek and the most deviation is from GCAP and the overall average absolute percent deviations is less than 4 % for pressures up to 300 psia (2069 kPa) and temperatures up to 160°F (71°C).


Fig 4. Water content by Raoult’s law vs GCAP and two simulators at 200 psia (1379 kPa)


Fig 5. Water content by Raoult’s law vs GCAP and two simulators at 300 psia (2069 kPa)


Table 2. Raoult’s law water content average absolute percent deviations from 4 methods


In addition to the sweet natural gas system, we have determined the equilibrium water mole fraction of propane vapor by simulators B and C, Bukacek method, and Raoul’s law (ideal). Table 3 presents the percent deviation of these 4 methods from the smoothed experimental water mole fraction reported in the GPA RR 132 [6]. The accuracy of these four methods are within experimental data. It should be noted that for temperatures of 53.8°F and 47.9°F, the corresponding experimental pressures were 98 psia and 90 psia, respectively. Since at these pressures and temperatures the state of propane was liquid, these two pressures were reduced slightly to 97.35 psia and 88.6 psia to produce 100% propane vapor.


Table 3. Propane vapor water content predictions vs RR 132 experimental data [6]


Conclusions:

The performance of Raoult’s law for predicting the water content of sweet natural gases against 4 methods is presented. The four methods are GCAP, Simulators A and B and Bukacek correlation. The following conclusions can be made:

  1. The Raoult’s law (Eq. 1) combined with an expression to estimate water vapor pressure (Eq. 2) is a simple tool for predicting the water content of sweet natural gases.
  2. In general, for a combination of pressure and temperature which results in less dense gas (low pressure and high temperature), there are fewer deviations of Raoult’s law from simulator results that are based on an EOS (equation of state).
  3. Table 2 indicates that Raoult’s water content predictions have the least deviation from Bukacek correlation and the most deviations from GCAP.
  4. The overall average absolute percent deviations for the systems considered in this tip are less than 4%  and the maximum deviation is less than 13.6% (Table 2) for pressures up to 300 psia (2069 kPa) and temperatures up to 160°F (71°C).


To learn more about similar cases and how to minimize operational problems, we suggest attending our G4 (Gas Conditioning and Processing), G5 (Practical Computer Simulation Applications in Gas Processing), and G6 (Gas Treating and Sulfur Recovery) courses.

PetroSkills offers consulting expertise on this subject and many others. For more information about these services, visit our website at http://petroskills.com/consulting, or email us at consulting@PetroSkills.com.

By: Dr. Mahmood Moshfeghian


Interested in receiving Tip of the Month email updates? Sign up today!


References

  1. R. Kobayashi, “Water content of ethane, propane, and their mixtures in equilibrium with water and hydrates,” Gas Processor Association Research Report (GPA RR 132), Tulsa, Oklahoma, 1991.andSong, K
  2. GCAP 9.2.1, Gas Conditioning and Processing, PetroSkills/Campbell, Norman, Oklahoma, 2015.
  3. Bukacek, R.F., “Equilibrium Moisture Content of Natural Gases” Research Bulletin IGT, Chicago, vol 8, 198-200,  1959.
  4. Wagner, W.  and Pruss, A.,  J. Phys. Chem. Reference Data, 22, 783–787, 1993.
  5. GPSA Engineering Data Book, Section 20, Volume 2, 13th Edition, Gas Processors and Suppliers Association, Tulsa, Oklahoma, 2012.
  6. Campbell, J.M., Gas Conditioning and Processing, Volume 1: The Basic Principles, 9th Edition, 2nd  Printing, Editors Hubbard, R. and Snow–McGregor, K., Campbell Petroleum Series, Norman, Oklahoma, 2014.

0 responses to “Ideal Water Content Correlation for Sweet Natural Gas”

  1. […] Moshfeghian, M.,  “Ideal Water Content Correlation for Sweet Natural Gas,” PetroSkills TOTM, May […]

Optimizing Performance of Refrigeration System with Flash Tank Economizer

Continuing the January 2008 [1] Tip of The Month (TOTM), this tip demonstrates two methods to optimize the performance of a refrigeration system employing a flash tank economizer and two stages of compression. Specifically, we will minimize the compressor total power and condenser duty by optimizing the interstage pressure.


The details of a simple single-stage refrigeration system and a refrigeration system employing one flash tank economizer and two stages of compression are given in Chapter 15 of Gas Conditioning and Processing, Volume 2 [2]. The process flow diagram for a flash tank economizer refrigeration system with two stages of compression is shown in Figure 1. Note that provisions have been made to consider pressure drop in the suction line of the first stage compressor.


Figure 1. Process flow diagram for a refrigeration system with a flash tank economizer and two stages of compression


Let’s consider removing 10.391×10⁶ kJ/h (2886 kW) from a process gas at -35°C and rejecting it to the environment by the condenser at 35°C. Pure propane is used as the working fluid. In this study, all the simulations were performed by UniSim Design software [3]. Assuming 5 kPa pressure drop in the chiller, the pressure of saturated vapor leaving the chiller at -35°C is 137.4 kPa.  Also, assuming 30 kPa pressure drop in the suction line, the first stage compressor suction pressure is 107.4 kPa. The condensing propane pressure at 35°C is 1220 kPa. The condenser pressure drop plus the pressure drop in the line from the compressor discharge to the condenser was assumed to be 50 kPa; therefore, compressor discharge pressure is 1270 kPa. In addition, an adiabatic efficiency of 75% was assumed for both stages of compression.

Assuming no pressure drop between the two stages, Figure 2 presents the variation of the compressor stages 1, 2, and the total power as a function of the interstage pressure.


Method 1:

The “Databook” option from “Tools” menu of the UniSim was used to generate powers (dependent variables) as a function of interstage pressure (Independent variable). The interstage pressure was varied from 200 kPa to 1000 kPa with an increment of 10 kPa.

As can be seen in this figure, the optimum interstage pressure is about 470 kPa. This pressure corresponds to the minimum total power and also the equality of stages 1 and 2 power.


Figure 2. Impact of interstage pressure on compressor power.


Similarly, Figure 3 presents the compressor total power, stages 1 and 2 compression ratios. Figure 3 clearly shows that the minimum total compressor power does not occur at equal stage compression ratios of  3.44. Yet Chapter 14 (Compressors) of Gas Conditioning and Processing, Volume 2 [2] states “The total power is typically minimized when the ratio in each stage is the same.”  Why is that not the case here?

The ideal optimum interstage pressure based on equal compression ratios can be found by the following equation:


The equal compression ratio for each stage is R= 369.3/107.4 = 3.44 and  R= 1270/369.3 = 3.44. The above equation is valid if the mass flow rates through both stages were the same and the suction temperatures for both stages were equal. In a refrigeration system with flash tank economizers and multiple stages of compression, usually neither of these conditions are met.  In this case, the mass flow rates through stages 1 and 2 are 3.106 x 10⁴ and 4.171 x 10 4 kg/h, respectively. The suction temperatures are -35.8°C and 21.1°C, respectively.


Figure 3. Impact of interstage pressure on the total compressor power and stages compression ratio.


Method 2:

An alternative and easier method to determine the optimum interstage pressure is the “Adjust” tool in the simulation software. As shown in Figure 1, ADJ-2 was used to vary interstage pressure (stream R-12) so that first stage “R-Comp-LP Power” power becomes equal the second stage “R-Comp-HP Power” power. The setup for ADJ-2 is shown in Figure 4 and the detail of iterations and final results are shown in Figure 5. As shown in Figure 5, the optimum interstage pressure is 471.3 kPa and each stage compression power is 793 kW which adds up to a minimum total power of 1586 kW.


Summary:

Because the mass flow rates and suction temperatures were different in each stage of compression, the minimum total compressor power does not occur at equal compression ratios in each stage.

Two methods of “Databook” and “Adjust” were used to minimize the total compression power and condenser duty by selecting the optimum interstage pressure.

In the first method “Databook”, the optimum interstage was determined by minimizing the total compressor power. In the second method “Adjust”, the interstate pressure was determined by equalizing stages 1 and 2 powers. Both methods gave the same interstage pressure and total compressor power.


Figure 4. Detail of “Adjust” set up


Figure 5. Iteration and final results of “Adjust”


For the same chiller duty, chiller and condenser temperatures, and pressure drops, the results of the flash tank economizer system are compared with the results of a simple refrigeration system in Table 1. This table indicates that the compressor power and condenser duty saving are 17.4 % and 6.97 %, respectively. The interstage pressure drop is unique to flash tank economizer and its effect is the reduction of the power saving when compared to the simple refrigeration system and increases the condenser duty.


Table 1. Refrigeration specifications and calculated results

To learn more about similar cases and how to minimize operational problems, we suggest attending our G4 (Gas Conditioning and Processing), G5 (Practical Computer Simulation Applications in Gas Processing), and G6 (Gas Treating and Sulfur Recovery) courses.

PetroSkills offers consulting expertise on this subject and many others. For more information about these services, visit our website at http://petroskills.com/consulting, or email us at consulting@PetroSkills.com.

Sign up to receive Tip of the Month emails!


References:

  1. Moshfeghian, M., http://www.jmcampbell.com/tip-of-the-month/2008/01/refrigeration-with-flash-economizer-vs-simple-refrigeration-system/,  Tip of the Month, January 2008.
  2. Printing, Editors Hubbard, nd Edition, 2thCampbell, J.M., “Gas Conditioning and Processing, Volume 2: The Equipment Modules,” 9R. and Snow–McGregor, K., Campbell Petroleum Series, Norman, Oklahoma, 2014.
  3. UniSim Design R443, Build 19153, Honeywell International Inc., 2017.

1 response to “Optimizing Performance of Refrigeration System with Flash Tank Economizer”

  1. Art says:

    The article is excellent in revisiting this important subject. However, the quality of the Figure 1 flow diagram is terribly hard to read – especially for an old engineer like myself. Is there any way one could obtain a sharp and readable process flow diagram? It would be greatly appreciated because it would allow me to follow the explanations, logic, and the process balance.
    Thank you,
    Art Montemayor

Correlations for Vapor Pressure of Crude Oil Measured by Expansion Method (VPCRx)

Accurate measurement and prediction of crude oil and natural gas liquid (NGL) products vapor pressure are important for safe storage and transportation, custody transfer, minimizing vaporization losses and environmental protection. Vapor pressure specifications are typically stated in Reid Vapor Pressure (RVP) or/and True Vapor Pressure (TVP). In addition to the standard procedures for their measurements, there are rigorous and shortcut methods for their estimation and conversion.


Based on ASTM D323, there are figures and monographs for conversion of RVP to TVP for NGLs (Natural Gas Liquids) and crude oil at a specified temperature [1, 2]. Continuing the February 2016 [3] Tip of The Month (TOTM), this tip will present simple correlations for determination TVP and RVPE (Reid Vapor Pressure Equivalent) as described by ASTM Standard D6377-14 [4] at a specified temperature. The correlations are easy to use for hand or spreadsheet calculations.


Standard D6377 describes the use of automated vapor pressure instruments to determine the vapor pressure exerted in the vacuum of crude oils. This test method is suitable for testing samples that exert a vapor pressure between 25 kPa and 180 kPa at 37.8 °C (3.63 psia and 26.1 psia at 100 °F)  at vapor-liquid ratios from 4:1 to 0.02:1 (V/L = X = 4 to 0.02). A TVP reading can be determined by taking vapor pressure measurements at different expansion (V/L = X) ratios and extrapolating to V/L= X = 0.  Refer to reference [4] for detail description of this standard procedure.


To demonstrate the ASTM Standard D6377 procedure we generated vapor pressures of a sample condensate shown in Table 1 at four expansion ratios of  X = 1, 2, 3, 4 using ProMax simulation program [5] based on the Soave Redlich Kwong equation of state [6]. In this table, the heavy ends are presented by F-fractions and their properties are shown in Table 2.


Table 1. Composite of condensate


Table 2. Properties of the heavy end fractions used in Table 1

Table 3 presents the generated vapor pressure at 37.8 °C (100 °F) for four expansion ratios by ProMax mimicking the experimental measurements.


Table 3. Vapor pressure at 37.8 °C (100 °F) for four expansion ratios


Quadratic Equation:

The vapor pressures (VP) as a function of expansion ratio (X) in Table 3 were curve fitted to a quadratic equation as follows.

VP = a + bX +cX2


The fitted parameters a, b, and c are presented in Table 4 for pressures of Table 3 in kPa and psia.


Table 4. Fitted parameters for quadratic equation


1AAPD           = Average Absolute Percent Deviation

2MAPD          = Maximum Absolute Percent Deviation

3NP                = Number of data Points (NP)


Figure 1 presents the generated vapor pressure (filled circles) and  the quadratic fit (solid line) of the condensate of Table 1. The extrapolated vapor pressure at X=0 (expansion ratio) is 8.56 psia (59.0 kPa). This extrapolated vapor pressure matches very closely with the predicted bubble point of condensate of Table 1 by ProMax.


Figure 1. Quadratic fit of vapor pressure vs. expansion ratio


Exponential Equation:

The vapor pressures (VP) as a function of expansion ratio (V/L = X) in Table 3 can also be fitted to an exponential equation as follows.

VP = αe(βX)


The fitted parameters α and β are presented in Table 5 for pressures in Table 3 in kPa and psia.


Table 5. Fitted parameters for exponential equation


1AAPD           = Average Absolute Percent Deviation

2MAPD           = Maximum Absolute Percent Deviation

3NP                 = Number of data Points (NP)


Figure 2 presents the generated vapor pressure (filled circles) and the exponential fit (solid line) of the condensate of Table 1. The extrapolated vapor pressure at X=0 (expansion ratio) is 8.56 psia (59.0 kPa). Similar to the quadratic fit, this extrapolated vapor pressure matches very closely with the predicted bubble point of condensate of Table 1 by ProMax.


Figure 2. Exponential fit of vapor pressure vs. expansion ratio


ASTM D6377 RVPE:

The RVPE (Reid Vapor Pressure Equivalent) can be estimated by the following correlations:

a. Average bias of different crude oils [7]

RVPE = A x VPCRX=4 (at 100 °F or 37.8°C) + B

where A = 0.752 and B=0.88 psi (6.07 kPa).

For the condensate of Table 1 and from Table 3, VPCRX=4 = 7.63 psi (52.63 kPa)

RVPE = 0.752 x 7.63 + 0.88 = 6.62 psi

RVPE = 0.752 x 52.62 + 6.07 = 45.64 kPa


b. New correlation for ‘live’ crude  oils (for samples in pressurized floating piston cylinders) [4]

RVPE = 0.834 x VPCRX=4 = 7.63 psi (52.63 kPa)

RVPE = 0.834 x 7.63 = 6.36 psi

RVPE = 0.834 x 52.62 = 43.89 psi


c. New correlation for ‘dead’ crude oils (for samples in non-pressurized 1-liter sample containers) [4]

RVPE = 0.915 x VPCRX=4 (at 100 °F or 37.8°C)


Summary:

For accurate measurements, standard procedures outlined in ASTM D6377–14 and other guidelines should be consulted.  Several organizations are currently working to improve the accuracy of TVP estimation from RVP and/or VPCRx (ASTM D6377) measurement techniques. In all cases, Federal and State Laws and Regulations should be followed for safety and environmental protection.


A quadratic and an exponential correlation were presented to curve fit the measured vapor pressures at different expansion (V/L = X) ratios (e.g. 1, 2, 3, and 4). To demonstrate ASTM D6377 true vapor pressure measurements, a sample condensate vapor pressures at expansion ratios of V/L = X = 1, 2, 3, and 4 were estimated by ProMax, mimicking vapor pressure measurements. The estimated vapor pressures were curve fitted and extrapolated to zero expansion ratio (V/L = X) to estimate TVP. Then correlations of D6377 were used to estimate RVPE using the vapor pressure measurement at the expansion ratio of V/L = X = 4.


Figures 1 and 2 present almost a linear relationship between vapor pressure vs expansion ratio due to the narrow range of expansion ratio (1 through 4).  As shown in the Appendix, for a wider range of expansion ratios (5 through 50), vapor pressure vs expansion ratio is non-linear. In addition, the quadratic fit with three coefficients gives a better fit compared to exponential fit with only two coefficients.


To learn more about similar cases and how to minimize operational problems, we suggest attending our G4 (Gas Conditioning and Processing), G5 (Advanced Applications in Gas Processing), and PF4 (Oil Production and Processing Facilities), courses.


PetroSkills offers consulting expertise on this subject and many others. For more information about these services, visit our website at http://petroskills.com/consulting, or email us at consulting@PetroSkills.com.


By: Dr. Mahmood Moshfeghian


References:

  1. Campbell, J.M., Gas Conditioning and Processing, Volume 1: The Basic Principles, 9th Edition, 2nd Printing, Editors Hubbard, R. and Snow–McGregor, K., Campbell Petroleum Series, Norman, Oklahoma, 2014.
  2. ASTM D323: Standard Test Method for Vapor Pressure of Petroleum Products (Reid Method), 1999.
  3. Moshfeghian, M., http://www.jmcampbell.com/tip-of-the-month/2016/02/correlations-for-conversion-between-true-and-reid-vapor-pressures-tvp-and-rvp/, 2016
  4. ASTM D6377: Standard Test Method for Determination of Vapor Pressure of Crude Oil: VPCRX  (Expansion Method), 2014
  5. ProMax 4.0, Bryan Research and Engineering, Inc., Bryan, Texas, 2017.
  6. Soave, G., Chem. Eng. Sci. Vol. 27, No. 6, p. 1197, 1972.
    ASTM D6377: Standard Test Method for Determination of Vapor Pressure of Crude Oil: VPCRx  (Expansion Method), 2003.


Appendix:


Table 3A. Vapor pressure at 37.8 °C (100 °F) for three expansion ratios


Table 4A. Fitted parameters for quadratic equation


1AAPD       = Average Absolute Percent Deviation

2MAPD      = Maximum Absolute Percent Deviation

3NP             = Number of data Points (NP)


Figure 1A. Quadratic fit of vapor pressure vs. expansion ratio


Table 5A. Fitted parameters for quadratic equation


Figure 2A. Exponential fit of vapor pressure vs. expansion ratio

1 response to “Correlations for Vapor Pressure of Crude Oil Measured by Expansion Method (VPCRx)”

  1. Lina says:

    Good day,

    Thanks for your informative articles.
    I want to know when are you issuing December 2017.

    Thanks and best regards,