Should unplanned maintenance jobs be recorded as near misses?

OSHA mentions “near-misses” as recordable requirements in several passages as: “An unplanned and unforeseeable event that could have resulted, but did not result, in human injury, damage to property or the environment or other form of loss”And we know that all industrial maintenance organizations have a history of reactive, run-to-failure-then-run-to fix, maintenance management behaviors.  JMC’s emphasis on process and equipment reliability and operations management helps to bring facilities out of the reactive mode, but reactive maintenance jobs are still all too prevalent.  Some, or many of these reactive jobs “could have resulted, but did not result, in human injury, damage to property or the environment or other form of loss”.

Safety is everyone’s number one goal.  Most corporate safety programs define near-misses, but few connect the dots between recordable incidents and the degree of reactive, unplanned maintenance work.  The famous safety pyramid is quite familiar, but that’s only the tip of the safety iceberg.  Below the ‘water line’ of recordable first aids (lagging indicators) lie near-misses and, at the base of it all, safe behavior.  These are the leading indicators of our safety performance. This Tip of the Month will tie reactive maintenance and safe behavior together.

Recent data, compiled by Belgian’s BEMAS, clearly links accidents with injuries to the percent of reactive maintenance work (the opposite of planned and scheduled work).  If, indeed, a company uses the near-miss definition, how can it not require the recording of some, if not all, unplanned maintenance jobs?

An iceberg is a good metaphor for Safety; most of its mass lies beneath the surface and we see only the tip.  The safety pyramid compares the quantity of accidents in layers with fatality on the top and reportable incidents on the bottom.  But the real basis of safe behavior lies underneath the reporting surface and is comprised of near misses and unsafe behaviors.

For over 33 years I have been focused on driving down unplanned maintenance jobs through training and consulting on control of work.  We all should know that planned maintenance is simply safer!  But we have been reluctant to tie urgent, reactive jobs to unsafe practices.  In 2012, it’s time to ask “Should unplanned maintenance jobs be recorded as near-misses”?

In a nearly parallel development path, our emphasis and understanding of safe work environments has also been refined.  With the help of several catastrophic events, like the Texas


City refinery and, more recently Deepwater Horizons, and many smaller injury-causing accidents, our industry has put safety on the front burner.

A useful way to look at the safety pyramid (Figure 1) is to draw the dividing plane at what is reported and not reported.  This brings behavior-based safety programs, which we all talk about, into perspective. A key point here is the separation of leading indicators and lagging indicators.  It’s obvious to record Incidents and Accidents after they happen, but less obvious to capture near-misses and instill safe behaviors.

Recent data (Figure 2), presented by Wim Vancauwenberghe [1] of the Belgian Maintenance Association (BEMAS) at last year’s SMRP (Society for Maintenance and Reliability Professionals) annual conference shows the impact of unplanned maintenance jobs on the rate of accidents with injuries; and subsequent reduction in injuries as the percentage of planned work increases.

This raises the question in this paper, and it’s time we asked.

Clearly, not every unplanned maintenance job involves the same level of risk.  We can use a risk-based approach as in Figure 3 to indicate when an unplanned job becomes a near miss.  When we look at the spectrum of behavior from risk averse upwards to reckless, we can begin to establish some range of criteria for defining what to report. Applying the risk spectrum to the nature of unplanned jobs, we would expect risk to increase due to some factors.  Typical risk matrices compare event likelihood to its consequence to determine level of risk.  Should we develop something similar for unplanned jobs?  This tip attempts to describe the conditions that would determine the level of risk in jobs.  Perhaps there are companies who have successfully addressed this issue and, hopefully they will contribute to this discussion.


OSHA distinguishes Accident, Incident and Near Miss with the definitions in Figure 4.  However, trying to define what ‘could’ have happened in every urgent job opens a Pandora’s Box that probably wouldn’t be very productive.  On the other hand, we could approach the near miss issue by defining ‘failure’ more carefully.  Taking the familiar P-F curve, we might be able to say that earlier definition of failure at the P point and the subsequent maintenance job would inherently be safer than reacting to a failure at the F point.  Figure 5 shows how that might work.  We could say that anytime we have an unexpected complete failure of equipment, it must be reported as a near miss, whereas, if we detect a potential failure and plan and schedule the maintenance action before complete functional failure, it wouldn’t need to be reported because it is not a near miss.


If we are going to require near misses to be reported, another issue is raised:  How is a near miss to be reported?  What do we do with the report?  How much information/data is required on such a report?  If we’re going to require a report, we will have to define what and how much detail is required.

There are several possible uses for a near miss report.  Whatever decision we take, will impact our staff with more information gathering tasks.  What is it worth?  How can we successfully use the report to lower near misses and effect safer behavior?  Or, drive down reactive maintenance work?

  • Used as a way to ‘speak up’ with the rest of the crew and raise their awareness would not require as much information about what happened,
  • Determine preventability of the near miss with root cause analysis would require a great deal more information.

The fundamental questions are:

  • How do we raise the awareness of near misses with the target to reduce them?
  • What distinguishes a near miss from an incident?
  • If unplanned maintenance jobs carry higher safety risk, how do we break our reactive maintenance habits?
  • What criteria do we use to define levels of risk?

In order to determine how the professional SMRP audience would distinguish the reportability of near misses, several situations were presented for the participants to vote using the following choices:

  1. Do it and report as a near miss
  2. Near miss, Speak up!
  3. Risky behavior, don’t tell anyone
  4. No risk, just do it!
  5. Do not proceed without a planned work order

The sample situations were:

  • Urgent restart of a 100 hp motor after unexpected stoppage
  • Talking on your cell phone while driving
  • Vehicle crossing your path while running a yellow light
  • 5 lb. (2.27 kg) hammer dropped from scaffolding
  • Hurrying to replace hydraulic fitting without lock out, tag out
  • 2 ton lifting sling frayed, but go ahead and use it

Results of this voting may be published in a subsequent TOTM, or send an email to the author, perry.lovelace@jmcampbell.com.

In conclusion, we have raised the question and some of the issues around the question “Should unplanned maintenance jobs be recorded as near misses?”  There is not a simple answer and our profession must continue to explore the issues and make efforts to create a safer workplace through planned and scheduled maintenance work.

To this end, JMC offers training related to reducing unexpected failures:

  • The Operations Management discipline is directly focused on reduction of unplanned events through better control of work,
  • Operator Training broadens facilities operators’ competencies by teaching how facilities work and why certain events happen,
  • Mechanical and Reliability disciplines help identify onset of equipment failures.  Reliable equipment is safer equipment,
  • Many facilities use contractors for maintenance; their safety is also important.  JMC’s Supply Chain and Procurement disciplines concentrate on better contractor relationships in our SC-41 course.

To learn more about similar cases and how to minimize operational problems, we suggest attending our G40 (Process/Facility Fundamentals), G4 (Gas Conditioning and Processing), G5 (Gas Conditioning and Processing-Special), P81 (CO2 Surface Facilities), PF4 (Oil Production and Processing Facilities), and PL 4 (Fundamentals of Onshore and Offshore Pipeline Systems) courses.


John M. Campbell Consulting (JMCC) offers consulting expertise on this subject and many others. For more information about the services JMCC provides, visit our website at www.jmcampbellconsulting.com, or email your consulting needs to consulting@jmcampbell.com.


By: Perry Lovelace, Sr. Staff Instructor

References:

  1. Vancauwenberghe, Wim; The Basics of Safe Maintenance; The Belgian Maintenance Association; 2011.

11 responses to “Should unplanned maintenance jobs be recorded as near misses?”

  1. Victor Bautista says:

    Excelent.

  2. Rod sulik says:

    For the most part, I agree with the statements in this month’s tip. Not only at my current worklace have I witnessed “crash maintenance” become the standard. In my opinion this is not only hazardous because of the potential that the machine in question could come apart while an operator is in the immediate area. Once the unit has gone past its scheduled preventative maintenance period, it also fails much more often, potentially causing a lot of overtime, thus burning out the staff, due to after hours callouts. Should the unit in question be a critical piece of machinery, it could have a domino effect upon failure, shutting down the rest, or a large portion of the plant as well.

  3. Reid Glenn says:

    Perry has hit the nail on the head here handsomely.
    An urgent restart of the motor sounds to me like the operators did not find out why it went down in the first place and just hit the starter – not following practise.
    Talking on my cell phone while driving is ILLEGAL IN ALBERTA – you can be charged and convicted – let’s never go there.
    Oh a vehicle crossed my path while I am running a yellow light – How do I explain that to my wife and/or children as a safety professional? I approach intersections with lights as if the light will change at the worst possible time.
    The last three incidents are near misses.
    Learn from the mistakes of others – you will not live long enough to make them all yourself.

  4. Thanks so much with regard to giving me personally an update on this subject matter on your web site. Please know that if a fresh post becomes available or in the event that any modifications occur about the current write-up, I would be considering reading more and focusing on how to make good use of those approaches you talk about. Thanks for your time and consideration of people by making this blog available.

  5. I must thank you for the efforts you’ve put in penning this
    website. I am hoping to check out the same
    high-grade blog posts by you in the future as well.
    In truth, your creative writing abilities has encouraged me to get my own, personal blog now 😉

  6. Claudio says:

    Thank you, I have recently been searching for info approximately this topic for
    a while and yours is the greatest I’ve found out so far.
    But, what concerning the bottom line? Are you sure about the supply?

  7. What’s Taking place i am new to this, I stumbled upon this I have discovered It positively helpful and it has aided me out loads.

    I am hoping to contribute & aid other customers like its aided me.
    Great job.

  8. Marlen Kalk says:

    Thank you, I’ve recently been hunting for information about this subject matter for ages and yours is the best I have found so far.

  9. Buy Proxies says:

    DreamProxies.com — cheapest professional private proxies with 50% discount! Top notch quality, Limitless proxies, Super speed along with Least expensive rates — simply $0.25 for each proxy! Very best personal proxies only on DreamProxies.com

  10. DreamProxies.com : lowest priced professional private proxies with 50% discounted! Top notch quality, Unlimited proxies, Excellent speed and also Least expensive price ranges : only $0.25 for every proxy! Ideal personal proxies only on DreamProxies.com

Low Pressure Versus High Pressure Dense Phase Natural Gas Pipeline Transportation

Dense phase is a favorable condition for transporting carbon dioxide (CO2) and natural gas as well as carbon dioxide injection into crude oil reservoir for enhanced oil recovery. Pipelines have been built to transport CO2 and natural gas [1] in the dense phase region due to its higher density, and this also provides the added benefit of no liquids formation in the pipeline.

Recently (January through April 2012 TOTMs) we discussed several aspects of transportation of carbon dioxide (CO2) in the dense phase. We illustrated how thermophysical properties change in the dense phase and their impacts on pressure drop calculations. The pressure drop calculation utilizing the liquid phase and vapor phase equations were compared. In the August 2012 Tip of The Month (TOTM) [2], we studied transportation of rich natural gas in the dense phase region and compared the results with the case of transporting the same gas using a two phase (gas-liquid) option. Our study highlighted the pros and cons of dense phase transportation.

In this TOTM, we will study the low pressure versus high pressure (dense phase) pipeline transportation of a lean natural gas. The application of dense phase in the oil and gas industry will be discussed briefly.

Case Study:

For the purpose of illustration, we will consider transporting a natural gas mixture with composition and conditions presented in Table 1. For simplicity, the calculations and subsequent discussion will be done on the dry basis. The feed gas dew point was reduced to -40 ˚F (-40 ˚C) by passing it through a mechanical refrigeration dew point control plant. Figure 1 presents the phase envelopes for the feed and lean (pipeline) gases. The composition and conditions of the lean gas are also presented in Table 1. The 1000 miles (1609 km) long pipeline with a  diameters of 42 inches (1067 mm) has been considered. A simplistic Process Flow Diagram (PFD) is shown in Figure 2. The following assumptions and correlations are/used:

  1. Dry basis, ignoring water.
  2. C7+ considered as nC8.
  3. Steady state
  4. Delivery pressure is 615 Psia (4.24 MPa).
  5. Pressure drop in each heat exchanger is 5 psi (0.035 MPa).
  6. No pressure drop in scrubbers and separators.
  7. Horizontal pipeline, no elevation change.
  8. Inside surface absolute roughness is 0.0018 in (0.046 mm).
  9. Single Phase Friction Factor: Colebrook
  10. For calculation purpose, each line segment was divided into 10 sub segments.
  11. Overall Heat Transfer Coefficient: 0.25 Btu/hr-ft2-˚F (1.42 W/m2-˚C).
  12. Simulation software: ProMax [3]
  13. Equation of State: Soave-Redlich-Kwong (SRK).

Table 1. Composition and conditions of the feed gas and lean gas


Figure 1. Phase envelopes for the feed (rich) and pipeline (lean) gas


Three cases for transportation of this natural gas are considered and each is explained briefly in the proceeding section. Figure 2 presents the PFDs for Cases A and B. Case C PFD is similar to Case B with 2 more pipeline segments, compressors and coolers. Figure 3 illustrates the pipeline systems in a block diagram.  The number of pipeline segments, segment length, and inlet pressure of each segment for the three cases are presented in Table 2 in the field (FPS, foot, pound and second) and SI (System International) sets of units.

Figure 2. Process flow diagrams (PFD) for Cases A and B (Case C is similar to Case B)


Figure 3. Pipeline Block Diagrams for Cases A, B, and C

Table 2. Pipeline specifications for the three cases


Case A: High Pressure (Dense Phase)

After passing through the first stage scrubber, the lean gas enters the first stage of compressor where its pressure is raised to 1407 psia (9.703 MPa), then it is cooled to 100 ˚F (37.8 ˚C) and compressed further in the second stage to 3220 Psia (22.2 MPa). The high pressure compressed gas is cooled back to 100 ˚F (37.8 ˚C) and then passed through a separator before entering the long pipeline (See Case A in Figure 2).


Case B: Intermediate Pressure

The process flow diagram (PFD) for this case is also shown in Figure 2. In this case, the pipeline is divided into three 333.3-mile (536.2 km) pipelines with one lead compressor station and two intermediate compressor stations. In each station, the pressure is raised from 615 Psia to 1966 Psia (4.24 to 13.56 MPa) in one stage and then cooled to 100 ˚F (37.8 ˚C), passed through a separator before entering the downstream pipeline segment.


Case C: Low Pressure

This case is similar to Case B except the pipeline is divided into five 200-mile (322 km) pipeline segments with one lead compressor station and 4 intermediate compressor stations. In each station, the pressure is raised from 615 Psia to 1600 Psia (4.24 to 11.03 MPa) in one stage and then cooled to 100 ˚F (37.8 ˚C), passed through a separator before entering the downstream pipeline segment.


Simulation Results and Discussions:

The PFDs for the three cases are simulated using ProMax [3]. To improve the accuracy and to take care of variations of physical properties of gas, each pipeline segment length was divided into 10 sub segments. For Case A in which pipeline segment was considerably longer, we tried 50 and 100 sub segments and no change in the outlet pressure and temperature was observed. Table 3 presents a summary of simulation results for the three cases in the field and SI system of units. As can be seen in this table, Case A requires the least total compression power and heat duty requirements. The power reduction for Case A is about 51%  compare to Case B and 63% compare to Case C. These reductions in power and heat duty requirements are considerable.  Similarly, the heat duty reduction for Case A is about 39% compared to Case B and 50 % compare to Case C, respectively.

Table 3. Summary of computer simulation results for the three cases.

Figure 4 presents the phase envelope, the required compression and cooling stages and pipeline pressure-temperature profile for Case A. This figure shows that the pipeline outlet condition ends up to the right of the dew point curve with the gas remaining as single phase.

Figure 4. Phase envelope, compression and cooling stages and pipeline pressure-temperature profile (ID=42 in = 1067 mm)

Pipeline wall thickness is an important economic factor. The wall thickness, t, for the three cases was calculated by:

Where,

P is maximum allowable operating pressure, here set to 1.1 times the inlet pressure,

OD is outside diameter,

E is joint efficiency (assumed to be 1),

f1 is wall thickness tolerance (assumed to be 1.0),

f2 is design factor, 0.4 to 0.72  and here set  to be 0.72 for remote area),

σ is the pipe material yield stress (assumed pipe material grade X65 to be 65,000 psi or

448.2 MPa), and

CA is the corrosion allowance (assumed to be 0 in or 0 mm, for dry gas).


Figure 5 presents the calculated wall thickness as a function of the inlet pressure (for the three cases). Notice Case A requires the largest and Case C requires the smallest wall thickness.

Variation of density, viscosity, velocity, pressure, and temperature along the pipeline are shown in Figures 6 through 10 for Cases A and B.

Conclusions:

We have studied transportation of natural gas in the dense phase region (high pressure) and compared the results with the cases of transporting the same gas using intermediate and low pressures. Our study highlights the following features:

  1. If the gas at the source is not at high enough pressure, considerable compression power and cooling duty may be required if the decision is to use the dense phase.
  2. For the dense phase – Case A, (high pressure), higher wall thickness is required.
  3. For the dense phase – Case A, lower compressor power and heat duty are required.
  4. For the dense phase – Case A, the friction pressure drop / mile is lower .
  5. For the dense phase – Case A and the same diameter, on the average the velocity is lower compared to lower pressure gas transportation.

Other logical results can be stated as well including:

  1. Composition of the gas plays an important role.
  2. Pipeline elevation profile and distance may be  important factors at the higher operating pressures.
  3. A detailed economic analysis in terms of CAPEX and OPEX should be made for a sound comparison.

In a future Tip of the Month, we will consider the design and order of magnitude costs impacts when constructing each of these three cases, first onshore then offshore.

To learn more about similar cases and how to minimize operational problems, we suggest attending our G40 (Process/Facility Fundamentals), G4 (Gas Conditioning and Processing), G5 (Gas Conditioning and Processing-Special), P81 (CO2 Surface Facilities), PF4 (Oil Production and Processing Facilities), and PL 4 (Fundamentals of Onshore and Offshore Pipeline Systems) courses.

John M. Campbell Consulting (JMCC) offers consulting expertise on this subject and many others. For more information about the services JMCC provides, visit our website at www.jmcampbellconsulting.com, or email your consulting needs to consulting@jmcampbell.com.

By: Mahmood Moshfeghian and David Hairston

References:

  1. Beaubouef, B., “Nord stream completes the world’s longest subsea pipeline,” Offshore, P30, December 2011.
  2. http://www.jmcampbell.com/tip-of-the-month/
  3. ProMax 3.2, Bryan Research and Engineering, Inc., Bryan, Texas, 2012.


Figure 5. Variation of wall thickness with pipeline inlet pressure

Figure 6. Variation of gas density in the pipeline (Cases A and B)

Figure 7. Variation of gas viscosity in the pipeline (Cases A and B)

Figure 8. Variation of gas velocity in the pipeline (Cases A and B)

Figure 9. Variation of pressure in the pipeline (Cases A and B)

Figure 10. Variation of temperature in the pipeline (Cases A and B)

6 responses to “Low Pressure Versus High Pressure Dense Phase Natural Gas Pipeline Transportation”

  1. Odibo Arthur says:

    Thanks

  2. Edmund Wang says:

    Thanks.

  3. Mikhail says:

    Hello!

    Comparing the phase envelopes for the same composition feed gas presented in August TOTM (figure 4) and here (figure 1) it looks like that phase envelopes are different?

    For example cricondenbar P in Aug TOTM is 1500 psia, comparing to 2250 psia here for the same feed composition.

    Thanks.

  4. It’s just like you study my mind! You seem to realize a lot about it, just like you wrote a e-book there as well. I have faith that simply could use some g. h. for you to electricity the solution dwelling slightly, but instead of of which, that is definitely outstanding website. An incredible read. I will definitely be returning.

  5. vamsi krishna prasad says:

    figure 4 should have been plotted for cases B , C for better understanding.

    Can I conclude like this – As compressor discharge pressure increases the cost of pipe line(capex) increases.
    As no of compressor stations increase(for low pressure operation)the operating cost(opex) increases.

    Lowest cost (Opex + capex) of the system is attained at optimum (compressor discharge pressure & no of compressor stations)condtions ?

Transportation of Natural Gas in Dense Phase

When a pure compound, in gaseous or liquid state, is heated and compressed above the critical temperature and pressure, it becomes a dense, highly compressed fluid that demonstrates properties of both liquid and gas. For a pure compound above critical pressure and critical temperature, the system is oftentimes referred to as a “dense fluid” or “super critical fluid” to distinguish it from normal vapor and liquid (see Figure 1 in December 2009 Tip Of The Mont (TOTM) [1] for carbon dioxide and in January 2010 TOTM [2] for a typical natural gas). Dense phase is a fourth (Solid, Liquid, Gas, Dense) phase that cannot be described by the senses. The word “fluid” refers to anything that will flow and applies equally well to gas and liquid. Pure compounds in the dense phase or supercritical fluid state normally have better dissolving ability than do the same substances in the liquid state. The dense phase has a viscosity similar to that of a gas, but a density closer to that of a liquid. Dense phase is a favorable condition for transporting CO2 and natural gas as well as carbon dioxide injection into crude oil reservoir for enhanced oil recovery.

Pipelines have been built to transport CO2 and natural gas [3] in the dense phase region due to its higher density, and this also provides the added benefit of no liquids formation in the pipeline.

Recently (January through April 2012 TOTMs) we discussed several aspects of transportation of carbon dioxide (CO2) in the dense phase. We illustrated how thermophysical properties change in the dense phase and their impacts on pressure drop calculations. The pressure drop calculation utilizing the liquid phase and vapor phase equations were compared. In this TOTM, we will discuss the dense phase transportation of natural gas. The application of dense phase in the oil and gas industry will be discussed briefly.


Case Study:

For the purpose of illustration, we will consider transporting 244 MMSCFD (6.9×10⁶ Sm3/d) of a natural gas with composition presented in Table 1. The corresponding mass flow rate is 154.95 lbm/sec (70.28 kg/s). For simplicity, the calculations and subsequent discussion will be done on the dry basis. The 100 miles (160.9 km) long pipeline with inside diameters of 14 to 24 inches with an increment of 2 inches  (356 to 610 mm with an increment of 51 mm) have been considered. The inlet conditions are 580 psia (4000 kPa) and 86˚F (30˚C). The following assumptions and correlations are/used:

  1. Dry basis, ignoring water.
  2. C7+ considered as nC8.
  3. Steady state
  4. Delivery pressure is 580 psia (4000 kPa).
  5. Pressure drop in each heat exchanger is 5 psi (35 kPa).
  6. No pressure drop in separators.
  7. Horizontal pipeline, no elevation change.
  8. Inside surface absolute roughness is 0.0018 in (0.046 mm)
  9. Multiphase flow correlation: Beggs and Brill.
  10. Single Phase Friction Factor: Colebrook
  11. Number of Length Increments: 10 (Each segment is 10 mile (16.09 km)
  12. Overall Heat Transfer Coefficient: 0.25 Btu/hr-ft2-˚F (1.42 W/m2-˚C).
  13. Simulation software: ProMax [4]
  14. Equation of State: Soave-Redelich-Kwong (SRK).


Table 1. Composition of the feed gas

Two cases for transportation of this natural gas as shown in Figure 1 are considered and each is explained briefly in the proceeding section.Note this is a rich gas stream. A lean gas stream more typical of transmission pipelines would be: 93-97 % CH4, 1-2 % N2/CO2, balance C2+ (mole basis).


Case 1: Two Phase (Gas and Liquid)

The gas from the inlet separator (see Figure 1) is compressed to a sufficiently high pressure in two stages to just meet the delivery pressure of 580 psia (4000 kPa) at the destination. The compressed gas after each stage of compression is cooled to 100˚F (37.8˚C). The interstage pressure was set to give equal compression ratio in each stage and approximated the same power requirement for each stage. The outlet separator removes any condensed liquid.


Case 2: Dense Phase

The process flow diagram (PFD) for this case is exactly the same as for case 1 with two exceptions:

  1. The pipeline outlet pressure must end up in the dense gas phase region.
  2. A Joule-Thompson (JT) valve is added at the outlet of pipeline to reduce pressure to the specified delivery pressure of 580 psia (4000 kPa) and extract natural gas liquid (NGL).


Figure 1. Process flow diagrams (PFD) for cases 1 and 2


Simulation Results and Discussions:

The two PFDs shown in Figure 1 are simulated using ProMax [4] for the six different inside diameters. Table 2 presents a summary of simulation results for the six inside diameters considered in the field (FPS, foot, pound and second) and SI (System International) sets of units.

Figure 2 presents the variation of linear pressure drop per length as a function of inside diameter. As expected, the pressure drop decreases as diameter increases. This figure also shows that as diameter decreases, the pressure drop for the Two Phase case increases at a lower rate than the Dense Phase (ratio of pressure drop for small diameter/large diameter ≈ 6.6/1 for Two Phase and ≈ 15/1 for Dense Phase).

Figure 3 presents the variation of compressor power and cooling duty requirement as a function of inside diameter. Figure 3 indicates that as diameter decreases the energy requirement increases but the difference between the corresponding compressor power and cooling duty for the two cases decreases with smaller size pipelines.

Since no separation takes place between the inlet and outlet separators, the total composition remains the same as the gas passes through the compressors, coolers, pipeline and JT valve. The flow rate through the equipment between the separators remain constant at 238.73 MMSCFD (6.76×10⁶ Sm3/d). The corresponding mass flow rate is 142.67 lbm/sec (64.71 kg/s).    Figure 4 presents the phase envelope, the required compression and cooling stages and pipeline pressure-temperature profile for the inside diameter of 14 in (356 mm). This figure shows that for the Two Phase case, the pipeline outlet condition after passing through the retrograde region ends up in the two phase region with a liquid fraction of 1.81 %. For Dense Phase case, the pipeline outlet condition ends up above the dew point curve. After passing through the JT valve and reducing the pressure to the specified delivery pressure of 580 psia (4000 kPa), the produced liquid fraction is 3.15 %. In this case the NGL extraction (liquid condensed) is about 74% higher than the Two Phase case. However the Dense Phase case requires more compression power and cooling duties. Table 2 also indicates that:

  • While the fraction of NGL separated (3.15 %) for Dense Phase is independent of the inside diameter, it increases for Two Phase case as diameter deceases.
  • ΔP/unit length decreases with increasing diameter.
  • ΔP/unit length decreases with increasing pressure.
  • Rate of change of ΔP/(unit length-diameter) is lower in the Dense Phase. This is a metric for transportation efficiency – lower is better. Therefore, Dense Phase is the more efficient for transportation.


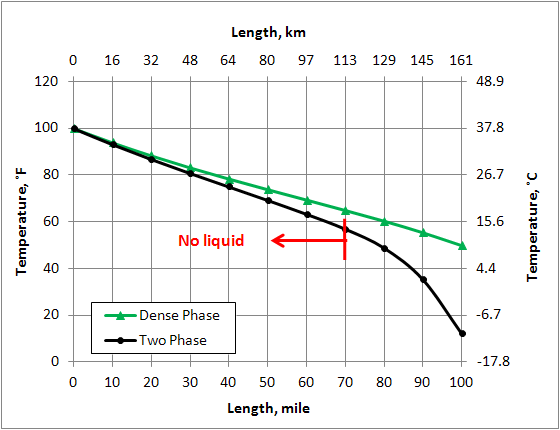
Figure 5 shows percent change of different variables of the Dense Phase with respect to the corresponding values in the Two Phase along the pipeline. The % change is defined as: . For the Two Phase case, liquid is formed to the right of the vertical red line at pipeline mile post 70 (113 km). Note that for the Dense Phase the density and viscosity increase compared to the corresponding values in the Two Phase along the pipeline. Toward the end of the line where liquid is formed in the Two Phase case, the increase in density is much higher than that of viscosity. As can be seen in Figure 5, for the Dense Phase, the pressure drop and velocity decrease in comparison to the Two Phase case. These are the factors that make Dense Phase transportation desirable.


Figure 2. Effect of inside diameter on linear pressure drop

Table 2. Summary of computer simulation results for six inside diameters.

 Figure 3. Effect of inside diameter on compressor power and cooling duty requirements

Figure 4. Phase envelope, compression and cooling stages and pipeline pressure-temperature profile (ID=14 in = 356 mm)


Figure 5. Percent change of different variable in the Dense Phase compared to the corresponding values in the Two Phase along the pipeline (ID=14 in = 356 mm)

            Figure 6 shows where liquid condensation in the pipeline is formed. Figure 6 also indicates that for the Two Phase case, the fluid passes through the retrograde region forming the maximum amount of liquid while no liquid is formed for the case of Dense Phase transportation.

Pipeline wall thickness is an important economic factor. The wall thickness, t, for 6 diameters studies was calculated by:

Where, P is maximum allowable working pressure (assumed to be 1.1 times the inlet pressure), OD is outside diameter, E is joint efficiency (assumed to be 1), f1 is wall thickness tolerance, 0.875 to 1.0 (assumed to be 1), f2 is design factor, 0.4 to 0.72 (assumed to be 0.72 for remote area), σ is the pipe material yield stress (assumed pipe material grade X65 to be 65,000 psi or 448.2 MPa), and CA is the corrosion allowance (assumed to be 0 in or 0 mm, for dry gas). Figure 7 presents the calculated wall thickness for the 6 diameters. Notice for the Dense Phase as the diameter decreases, the wall thickness also decreases even though the pressure increases. This is a favorable impact. Opposite behavior is observed for the Two Phase case in which wall thickness increases as diameter decreases (and pressure increases).

Variation of density, viscosity, velocity, pressure, and temperature along the pipe line are shown in Figures 8 through 12.


Figure 6. Variation of liquid holdup in the pipeline (ID=14 in = 356 mm)

 Conclusions:


We have studied transportation of natural gas in the dense phase region and compared the results with the case of transporting the same gas using a two phase (gas-liquid) option. Our study highlights the following features:

  1. If the gas at the source is not at high enough pressure, considerable compression power and cooling duty may be required if the decision is to use the dense phase.
  2. For the dense phase, higher wall thickness is required.
  3. For the dense phase, smaller inside diameter is required.
  4. For the dense phase, the friction pressure drop is smaller.
  5. For the dense phase and the same diameter, the velocity is lower compared to two phase.
  6. For the dense phase, there is a higher potential of NGL extraction due to JT valve expansion.
  7. Since there is no liquid condensation in dense phase, less or no pigging is required.

Other logical results can be stated as well including:

  1. Composition of the gas plays an important role.
  2. Pipeline elevation profile and distance are important factors.
  3. A detailed economic analysis in terms of CAPEX and OPEX should be made for a sound comparison.

To learn more about similar cases and how to minimize operational problems, we suggest attending our G40 (Process/Facility Fundamentals), G4 (Gas Conditioning and Processing), G5 (Gas Conditioning and Processing-Special), PF81 (CO2 Surface Facilities), and PF4 (Oil Production and Processing Facilities) courses.

John M. Campbell Consulting (JMCC) offers consulting expertise on this subject and many others. For more information about the services JMCC provides, visit our website at www.jmcampbellconsulting.com, or email your consulting needs to consulting@jmcampbell.com.

By: Dr. Mahmood Moshfeghian

References:

  1. http://www.jmcampbell.com/tip-of-the-month/2010/01/variation-of-properties-in-the- dense-phase-region-part-2-%E2%80%93-natural-gas/
  2. http://www.jmcampbell.com/tip-of-the-month/2010/01/variation-of-properties-in-the- dense-phase-region-part-2-%E2%80%93-natural-gas/
  3. Beaubouef, B., “Nord stream completes the world’s longest subsea pipeline,” Offshore, P30, December 2011.
  4. ProMax 3.2, Bryan Research and Engineering, Inc., Bryan, Texas, 2011.


Figure 7. Variation of wall thickness with diameter

Figure 8. Variation of gas density in the pipeline (ID=14 in = 356 mm)

Figure 9. Variation of gas viscosity in the pipeline (ID=14 in = 356 mm)

Figure 10. Variation of gas velocity in the pipeline (ID=14 in = 356 mm)

Figure 11. Variation of pressure in the pipeline (ID=14 in = 356 mm)
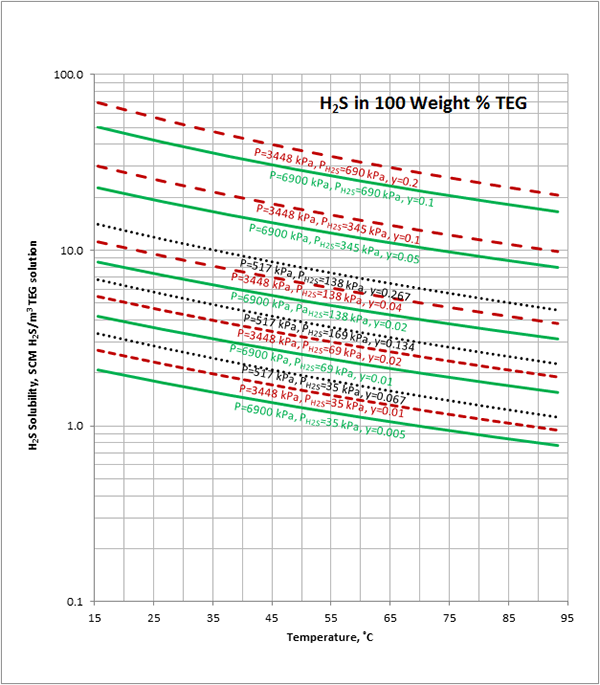
Figure 12. Variation of temperature in the pipeline (ID=14 in = 356 mm)

6 responses to “Transportation of Natural Gas in Dense Phase”

  1. stefan says:

    thank you very informational

  2. Stefan:
    You are welcome. I am glad you find it informational.
    Look for the follow up (Sep 2012)in which we discuss a long (1000 mile = 1610 km) pipeline transporting about 2 BSCFD.

  3. rachel says:

    If the same gas composition is used in Hysys dynamic to simulate the loading process up to a storage pressure above cricondenbar why hysys 7.3.1. with SRK-Twu and tuning factor predict the phase density lower than other method (and also predict a lower temperature at the and of loading).

  4. Rachel:
    I suggest the followings:
    1. Plot the phase envelope to find out how it compares with phase envelope presented in this TOTM.
    2. In working with HYSYS, it is better to use Peng-Robinson.
    3. Please note C+7 was treated as nC8 and the original SRK was used!
    I hope this helps.

  5. Kalpana.R says:

    Dear Mr. Mahmood Moshfeghian,
    Many thanks for the wonderful insight into the dense gas properties and the dense gas hydraulics through the pipeline. It appeared all simple after reaching your article. Your article is so very well written in simple terms and well explained using graphs. Thank you very much sir, it was enlightening.

  6. prabhakaran says:

    Thanks for the source.. I am eagerly looking to find the exact hysys package for supercritical fluid. I am using peng-Robinson package for high pressure compressor even though the fluid get condensed after aircooled condenser. If you have any solution to rectify the problem. kindly let me know.

Solubility of Acid Gases in TEG Solution: Part 2

In the June 2012 Tip of the Month (TOTM), we evaluated the accuracy of a recently published model by Mamrosh et al. [1] against experimental data for CO2 and H2S solubility in triethylene glycol (TEG) solution. Based on this model, we reproduced several diagrams that can be used quickly to determine the absorption of these acid gases in TEG solution. In this TOTM, we have used the same solubility model and produced more diagrams in a different format covering a wide range of operating conditions. The advantage of presenting diagrams in this new format is that less number of diagrams is needed. These diagrams are presented in terms of constant acid gas partial pressure for varying pressure and temperature and constant TEG concentration of 100 and 95 weight percent. A sample calculation showing the application of these diagrams is also provided and the result is compared with ProMax.

Predicted absorption levels for acid gases can be as high as about 10 SCF/gallon (75 SCM/m3) of TEG solution and depends on temperature, pressure, acid gas concentration in the vapor phase and TEG concentration. As shown in the June 2012 TOTM, the absorption of acid gases increases with TEG purity. The solution of acid gases in TEG solution lowers its pH and enhances corrosion. In addition, one of the main issues is dealing with the H2S that comes off the TEG flash separator and the still regenerator. This is a problem if vented (bad smell & toxic) and can be a significant source of emissions (SO2) if burned.

Mamrosh-Fisher-Matthews Solubility Model:

Recently, Mamrosh et al. [1] presented the following correlation based on the experimental data to estimate solubility of CO2 and H2S in TEG solution.

Wt%TEG is the weight % of TEG in liquid

The values of the A, B, C, D, and E parameters for international (SI) and engineering field (FPS) units are given in Table 1. For details of the calculation procedure and a sample calculation refer to reference [1].

Table 1. Parameters for Mamrosh et al. model [2]


Case Study:
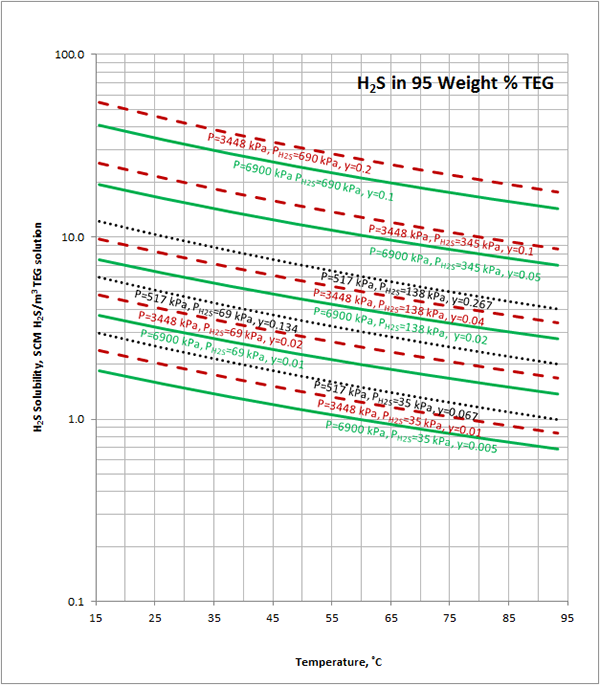
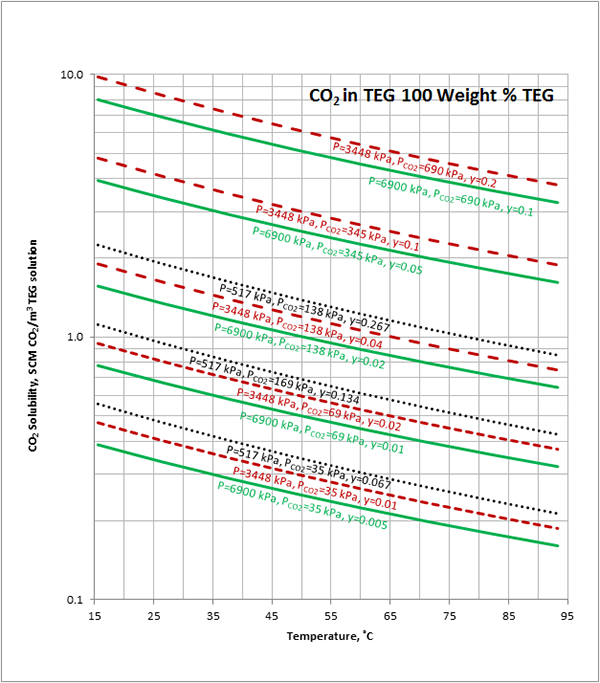
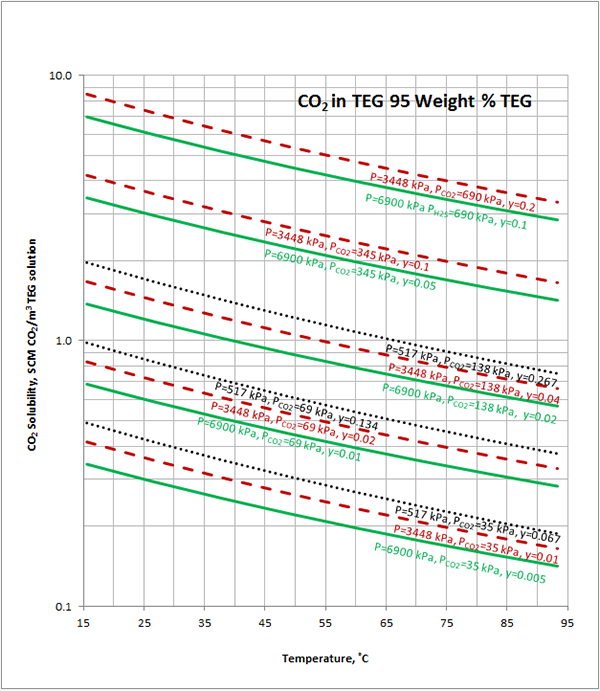
In Figures 1 through 4 we have reproduced the CO2 and H2S solubility (on volumetric basis of SCF/gallon of TEG solution or SCM/m3 of TEG solution) for TEG concentration of 100 and 95 weight % for pressures of 1000 and 500 (6897 and 3448 kPa) representing contactor pressure, and 75 psia (517 kPa) representing the flash separator in a typical TEG dehydration unit. In each of these diagrams the solubility is presented as a function of temperature, acid gas partial pressure (mole %) in the gas phase based on the model proposed by Mamrosh et al. [1]. These figures are reproduced in the field or Engineering (FPS) and SI (International) systems of units. They can be quickly used to estimate acid gas absorption by TEG solution. In addition, a sample application of these diagrams is presented in the following section.

The volumetric feed flow rate to a TEG dehydration plant containing 1 mole % H2S is 200 MMSCFD (5.6634×10⁶ SCMD). How many SCFD (SCMD) of H2S are released from the flash separator and regeneration column? The rich TEG concentration is 95 weight % and TEG circulation rate is 27 gallon/min (6.13 m3/h). Assume the contactor operates 100 ˚F (37.8 ˚C) and 1000 psia (6895 kPa). The flash drum operates at 75 psia (517 kPa) and 113 ˚F (45 ˚C) and there is about 6.7 mole % H2S in the flashed gas.

FPS Solution:

H2S partial pressure in feed gas = (0.01)(1000 psia) = 10 psia

From Figure 4 at T=100 ˚F, P = 1000 psia, H2S Partial Pressure= 10 psia,

0.36 SCF H2S/gallon of TEG is absorbed.

H2S partial pressure in flashed gas = (0.067)(75 psia) = 5 psia

From Figure 4 (FPS) at T=113 ˚F, P=75 psia, H2S Partial Pressure= 5 psia,

0.25 SCF H2S/gallon of TEG is absorbed.

H2S released with flashed gas = (27 gallon/min)(0.36-0.25)(SCF H2S/gallon TEG) =  2.97 SCF H2S/min = 4.28 MSCFD

H2S released in regenerator = (27 gallon/min)(0.25)(SCF H2S/gallon TEG) =  6.75 SCF H2S/min = 9.72 MSCFD

Total H2S released = 4.28 + 9.72 =13.997 MSCFD ≈ 14 MSCFD

H2S in Feed gas = (0.01)(200 000 MSCFD)=2000 MSCFD

Fraction of H2S absorbed = 100(14)/2000= 0.7 %

SI Solution:

H2S partial pressure in feed gas = (0.01)(6895 kPa) = 69 kPa

From Figure 4 (SI) at T=37.8 ˚C, P=6895 kPa, H2S Partial Pressure= 69 kPa,

2.7 SCM H2S/m3 of TEG is absorbed.

H2S partial pressure in flashed gas = (0.067)(517 kPa) = 35 kPa

From Figure 4 at T=45 ˚C, P=517 kPa, H2S Partial Pressure= 35 kPa,

1.9 SCM H2S/m3 of TEG is absorbed.

H2S released with flashed gas = (6.13 m3/h)(2.7-1.9)( SCM H2S/m3 TEG) = 4.904 SCM H2S/h = 117.7 SCM/d

H2S released in regenerator = (6.13 m3/h)(1.9)( SCM H2S/m3 TEG) = 11.647 SCM H2S/h = 279.5 SCM/d

Total H2S released= 117.7 + 279.5 =397.2 SCMD ≈ 400 SCMD

H2S in Feed gas= (0.01)( 5.6634×10⁶ SCMD)=56 634 SCMD

Fraction of H2S absorbed = 100(400)/56 634= 0.7 %

We performed a rigorous simulation of a similar case as the above case study by ProMax [2] and the fraction of H2S absorbed turned out to be 0.78 %.

Conclusions:

In continuation of the June 2012 TOTM and to reduce the number of diagrams, we have produced several acid gas solubility diagrams in a different format that can be used quickly to determine the amount of acid gas release in the flash separator and from the regenerator column of a TEG dehydration unit. These diagrams (Figures 1-4) are based on the model developed by Mamrosh et al. [1] and  are in the field (FPS) and SI systems of units and cover a wide range of operating conditions. For a case study, we have presented a sample calculation for estimation of H2S released with the flashed gas off the separator and from the overhead of the regenerator column. The results obtained for this case study compares well with those obtained from rigorous simulation using ProMax [2] software.

To learn more about similar cases and how to minimize operational problems, we suggest attending our G40 (Process/Facility Fundamentals), G4 (Gas Conditioning and Processing), G5 (Gas Conditioning and Processing-Special), PF81 (CO2 Surface Facilities), and PF4 (Oil Production and Processing Facilities) courses.

John M. Campbell Consulting (JMCC) offers consulting expertise on this subject and many others. For more information about the services JMCC provides, visit our website at www.jmcampbellconsulting.com, or email your consulting needs to consulting@jmcampbell.com.

By: Dr. Mahmood Moshfeghian


Reference:

  1. Mamrosh, D., Fisher, K. and J. Matthews, “Preparing solubility data for use by the gas processing industry:  Updating Key Resources,” Presented at 91st Gas Processors Association National Convention, New Orleans, Louisiana, USA, April 15-18, 2012.
  2. ProMax 3.2, Bryan Research and Engineering, Inc., Bryan, Texas, 2011.

Figure 1 (FPS). Estimated CO2 solubility in 100 weight % TEG solution as a function of temperature, CO2 mole % (partial pressure) in vapor phase and pressure

Figure 1 (SI). Estimated CO2 solubility in 100 weight % TEG solution as a function of temperature, CO2 mole % (partial pressure) in vapor phase and pressure

Figure 2 (FPS). Estimated H2S solubility in 100 weight % TEG solution as a function of temperature, H2S mole % (partial pressure) in vapor phase and pressure

Figure 2 (SI). Estimated H2S solubility in 100 weight % TEG solution as a function of temperature, H2S mole % (partial pressure) in vapor phase and pressure


Figure 3 (FPS). Estimated CO2 solubility in 95 weight % TEG solution as a function of temperature, CO2 mole % (partial pressure) in vapor phase and pressure


Figure 3 (SI). Estimated CO2 solubility in 95 weight % TEG solution as a function of temperature, CO2 mole % (partial pressure) in vapor phase and pressure


Figure 4 (FPS). Estimated H2S solubility in 95 weight % TEG solution as a function of temperature, H2S mole % (partial pressure) in vapor phase and pressure

Figure 4 (SI). Estimated H2S solubility in 95 weight % TEG solution as a function of temperature, H2S mole % (partial pressure) in vapor phase and pressure

3 responses to “Solubility of Acid Gases in TEG Solution: Part 2”

  1. ODIBO says:

    THANKS FOR YOUR UPDATE INFORMATION.KINDLY NOTIFY ME ANY NEW POST BY EMAIL.

    YOURS
    ARTHUR ODIBO

  2. This excellent website certainly has all the information and facts I needed concerning this subject and didn’t know
    who to ask.

  3. Thank you for hosting this festival. It will be cool to look through everyone’s entries.

Solubility of Acid Gases in TEG Solution

In gas dehydration service, triethylene glycol (TEG) will absorb limited quantities of BTEX (benzene, toluene, ethylbenzene, and xylene) and acid gases such as carbon dioxide (CO2) and hydrogen sulfide (H2S) from the gas. Predicted absorption levels for acid gases can be as high as about 10 SCF/gallon (75 SCM/m3) of TEG solution and depends on temperature, pressure, acid gas concentration in the vapor phase and TEG concentration. Figure 18.16 in reference [1] shows the solubility of H2S in TEG at various H2S partial pressures. This is true absorption that takes place in the absorber and corresponds to typical actual plant data. Figure 18.17 also in reference [1] shows solubility of CO2 in a 96.5 weight percent TEG solution. The absorption of acid gases increases with TEG purity. The solution of acid gases in TEG solution lowers its pH and enhances corrosion. In addition, one of the main issues is dealing with the H2S that comes off the still regenerator. This is a problem if vented (bad smell & poisonous) and can be a significant source of emissions (SO2) if burned.

In the June 2011 tip of the month (TOTM), we presented diagrams for quick estimation of absorption of BTEX in the glycol dehydration systems using the experimental vapor-liquid equilibrium data. The objective of this TOTM is to reproduce similar diagrams covering wide ranges of operating conditions. First we demonstrate the accuracy of a recent model proposed by Mamrosh et al. [2] against Gas Processors Association experimental data and then reproduce some of their recommended diagrams for approximate and quick estimation of acid gas absorption in TEG solution.

Mamrosh-Fisher-Matthews Solubility Model:

Recently, Mamrosh et al. [2] presented the following correlation based on the experimental data to estimate solubility of CO2 and H2S in TEG solution.

The values of the A, B, C, D, and E parameters are given in Table 1. For details of the calculation procedure and a sample calculation refer to reference [2].

Accuracy of Mamrosh-Fisher-Matthews Solubility Model:

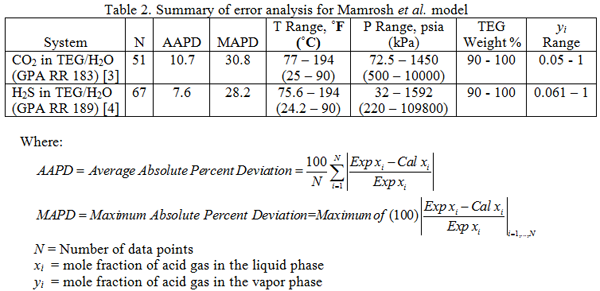
The accuracy of the Mamrosh et al. [2] model was evaluated against the experimental data of Gas Processor Association Research Reports RR 183 [3] and RR 189 [4] for CO2 and H2S solubility in TEG solution, respectively. The summary of our evaluation results is shown in Table 2.

It should be noted that for three cases of experimental data of H2S in TEG/H2O system, the absolute percent deviations were abnormally high (128, 260, and 319 %); therefore, they were eliminated from our analysis. Considering the error analysis shown in Table 2, the proposed model by Mamrosh et al. [2] has good accuracy for estimating solubility of acid gases in TEG/H2O solution. All experimental data reported in GPA RR 183 and RR 189 were collected at equilibrium. No consideration in the proposed model is given to the rate at which processes reach equilibrium.

Figures 1 and 2 present a graphical comparison of the calculated CO2 and H2S solubility (mole fraction of acid gas in the liquid phase) with the experimental data of GPA RR 183 and GPA RR 189 for CO2 and H2S, respectively. Overall, good accuracy is observed for both systems in these two figures. The ranges of data are the same as those shown in Table 2.


Figure 1. Accuracy of the proposed model by Mamrosh et al. [2] for estimating CO2 solubility in TEG solution against GPA RR 183 experimental data [3]


Figure 2. Accuracy of the proposed model by Mamrosh et al. [2] for estimating H2S solubility in TEG solution against GPA RR 189 experimental data [4]


In Figures 3 through and 8 we have reproduced the CO2 and H2S solubility (on volumetric basis of SCF/gallon of TEG solution or SCM/m3 of TEG solution) for pressures of 1000 and 500 (6897 and 3448 kPa) representing contactor pressure, and 50 psia (345 kPa) representing the flash separator in a typical TEG dehydration unit. In each of these diagrams the solubility is presented as a function of temperature, acid gas mole % in the gas phase, and H2O weight % in TEG solution based on the model proposed by Mamrosh et al. [2]. These figures are reproduced in the field or Engineering (FPS) and SI (International) systems of units. They can be quickly used to estimate acid gas absorption by TEG solution. In addition, Figures A1 through A6 in Appendix A present solubility of acid gases in terms mole fraction instead of volume basis.


Conclusions:

We have performed an independent evaluation of a recently developed model by Mamrosh et al. [2] for estimation of acid gas absorption by TEG solution while dehydrating natural gas.  Our evaluation was based on the experimentally measured data reported in the GPA RR 183 [3] and GPA RR 189 [4]. All experimental data reported in GPA RR 183 and RR 189 were collected at equilibrium. No consideration in the proposed model is given to the rate at which processes reach equilibrium.

The analysis of Figures 1 and 2 and Table 2 indicates, that even though the Mamrosh et al. [2] model is simple and easy to use, it is relatively accurate for estimation purposes. It also covers a wide range of operating conditions. Based on this model we have reproduced Figures 3 through 8 in the field and SI systems of units that can be used to estimate the absorption of CO2 and H2S in TEG solution during gas dehydration. The analysis of Figures 3 through 8 also indicates that at the same conditions, the solubility of H2S is almost 5 times greater than that of CO2. In addition, it can be concluded that the absorption of acid gases increase as:

  • Pressure increases
  • Temperature decreases
  • Acid gas concentration in gas phase increases
  • TEG concentration in liquid phase increases
  • TEG solution circulation rate increases

To learn more about similar cases and how to minimize operational problems, we suggest attending our G40 (Process/Facility Fundamentals), G4 (Gas Conditioning and Processing), PF81 (CO2 Surface Facilities), and PF4 (Oil Production and Processing Facilities) courses.


John M. Campbell Consulting (JMCC) offers consulting expertise on this subject and many others. For more information about the services JMCC provides, visit our website at www.jmcampbellconsulting.com, or email your consulting needs to consulting@jmcampbell.com.


By: Dr. Mahmood Moshfeghian


Figure 3 (FPS). Estimated solubility CO2 in TEG solution at 1000 psia as a function of temperature, CO2 mole % in vapor phase and water weight %


Figure 3 (SI). Estimated solubility CO2 in TEG solution at 6897 kPa as a function of temperature, CO2 mole % in vapor phase and water weight %


Figure 4 (FPS). Estimated solubility H2S in TEG solution at 1000 psia as a function of temperature, H2S mole % in vapor phase and water weight %


Figure 4 (SI). Estimated solubility H2S in TEG solution at 6897 kPa as a function of temperature, H2S mole % in vapor phase and water weight %


Figure 5 (FPS). Estimated solubility CO2 in TEG solution at 500 psia as a function of temperature, CO2 mole % in vapor phase and water weight %


Figure 5 (SI). Estimated solubility CO2 in TEG solution at 3448 kPa psia as a function of temperature, CO2 mole % in vapor phase and water weight %


Figure 6 (FPS). Estimated solubility H2S in TEG solution at 500 psia as a function of temperature, H2S mole % in vapor phase and water weight %


Figure 6 (SI). Estimated solubility H2S in TEG solution at 3448 kPa as a function of temperature, H2S mole % in vapor phase and water weight %


Figure 7 (FPS). Estimated solubility CO2 in TEG solution at 50 psia as a function of temperature, CO2 mole % in vapor phase and water weight %


Figure 7 (SI). Estimated solubility CO2 in TEG solution at 345 kPa psia as a function of temperature, CO2 mole % in vapor phase and water weight %

Figure 8 (FPS). Estimated solubility H2S in TEG solution at 50 psia as a function of temperature, H2S mole % in vapor phase and water weight %


Figure 8 (SI). Estimated solubility H2S in TEG solution at 345 kPa as a function of temperature, H2S mole % in vapor phase and water weight %

Reference:

  1. Campbell, J. M. “Gas conditioning and processing, Volume 2: The Equipment Modules,” John M. Campbell and Company, Norman, Oklahoma, USA, 2001.
  2. Mamrosh, D., Fisher, K. and J. Matthews, “Preparing solubility data for use by the gas processing industry:  Updating Key Resources,” Presented at 91st Gas Processors Association National Convention, New Orleans, Louisiana, USA, April 15-18, 2012.
  3. Davis, P.M., et al.; “The Impact of Sulfur Species on Glycol Dehydration – A Study of the Solubility of Certain Gases and Gas Mixtures in Glycol Solutions at Elevated Pressures and Temperatures, Revised RR Draft for Phase I: CO2/CH4/EG/TEG;” GPA Research Report, RR-183; Gas Processors Association., Tulsa Oklahoma, USA, 2002.
  4. Marriott, R.A., et al.; “The impact of Sulfur Species on Glycol Dehydration – A Study of the Solubility of Certain Gases and Gas Mixtures in Glycol Solutions at Elevated Pressures and Temperatures, VLE Data for the H2S/CH4/EG/H2O System and the H2S/CH4/TEG/H2O System,” GPA Research Report, RR-189; Gas Processors Association., Tulsa Oklahoma, USA, 2005.


Appendix A

Additional solubility Diagrams


Figure A1. Estimated solubility CO2 in TEG solution at 1000 psia [6897 kPa] as a function of temperature, CO2 mole % in vapor phase and water weight %


Figure A2. Estimated solubility H2S in TEG solution at 1000 psia [6897 kPa] as a function of temperature, H2S mole % in vapor phase and water weight %

Figure A3. Estimated solubility CO2 in TEG solution at 500 psia [3448 kPa] as a function of temperature, CO2 mole % in vapor phase and water weight %


Figure A4. Estimated solubility H2S in TEG solution at 500 psia [3448 kPa] as a function of temperature, H2S mole % in vapor phase and water weight %


Figure A5. Estimated solubility CO2 in TEG solution at 50 psia [345 kPa] as a function of temperature, CO2 mole % in vapor phase and water weight %


Figure A6. Estimated solubility H2S in TEG solution at 50 psia [345 kPa] as a function of temperature, H2S mole % in vapor phase and water weight %

8 responses to “Solubility of Acid Gases in TEG Solution”

  1. Abdelrahman says:

    very good study , thanks very much , however i think there is a typo error in the conclusion as follows:

    As per the presented graphs we can conclude that the absorption of acid gases increase as temperature decrease not increase, please verify and correct this typo error in the conclusion part of this study if needed
    again thanks alot for TOTM we are really so interested on it

  2. admin says:

    Thanks for your comment, Abdelrahman. This typo has been corrected.

  3. Charanjit Jootla says:

    Very informative and comphrensive. Do we have similar figures for low pressures at the Regenerator still where the pressure is close to atmospheric and the temperature is around 370 deg F ?

    This is to determine how much of H2S / CO2 will be in the lean TEG solution AFTER Regenerator stripping i.e. how much of H2S / CO2 is “unavoidable” in the lean TEG solution.

    Also, solubility data at the Regenerator conditions will help in doing a rough mass balance of the H2S and CO2 which comes out with the rich TEG, how much leaves via the Flash Drum / Regenerator and how much gets “recycled” back to the Contactor via the lean TEG stream.

  4. vamsi.krishnaprasad says:

    good one

  5. R Hussain says:

    Very informative article, thanks. – R Hussain

  6. Alex Dodic says:

    Since the article was written was a follow up study of solubility at regenerator conditions prepared?

  7. Luke Smith says:

    I had no idea that TEG would absorb limited quantities of BTEX and acid gasses! I can see how useful that would be as a way to remove unwanted aerosol compounds. I would imagine that finding a supplier of TEG to work with regularly would be a good way to keep your costs low as you lose it.

  8. Sue says:

    Dear Mahmood,
    Would like to know is there a way we can calculate the solubility of oxygen in TEG at ambient condition ?

    Or is it even possible that oxygen will dissolve into TEG when expose to ambient condition ?

Impact of Non-Hydrocarbons on the Reservoir Fluids Phase Envelope

Hydrocarbons are frequently produced with non-hydrocarbon impurities. The most common include water, carbon dioxide, hydrogen sulfide and nitrogen. We have already discussed water-hydrocarbon phase behavior in detail in the October and November 2007 Tips of the Month (TOTM). Since water has a low vapor pressure and is virtually immiscible in the hydrocarbon liquid phase, it does not have a significant effect on the shape of the hydrocarbon phase envelope except at high temperatures and low pressures.

The qualitative effect of CO2, H2S and N2 on the phase envelope of a rich gas or oil is shown in Figure 4.9 on page 100 in reference [1]. As shown in Figure 4.9 a and b, both CO2 and H2S lower the cricondenbar of the mixture. If sufficient quantities of the CO2 and H2S components are added to a reservoir fluid and the reservoir pressure is kept above the phase envelope, a single dense fluid phase exists. Although the actual mechanism is more complex, it is this solubility that is the primary driving force behind miscible flood enhanced oil recovery projects. NGL components such as ethane, propane and butane have a similar effect. With the increasing environmental concerns associated with acid gas (CO2 and/or H2S) injection into the reservoir and enhanced oil recovery, a  good understanding of the impact on phase behavior is essential.

Nitrogen, on the other hand, raises the cricondenbar and decreases miscibility. It is sometimes used for pressure maintenance. There are also a few nitrogen miscible floods.

In this TOTM, we will study the impact of CO2, H2S and N2 on the phase behavior of different reservoir fluids such as black oil, volatile oil, and a rich gas. Computer simulated phase envelopes showing the quantitative effect are presented and discussed.

The Peng-Robinson (PR) [2] equation of state (EOS) option of ProMax [3] was used to perform all of the calculations in this study. In dealing with high content acid gases or nitrogen, care should be taken to verify the accuracy of an equation of state for handling these constituents. In general it is wise to assume the equations of state are inaccurate for modeling the thermodynamic properties and the phase behavior of systems containing high concentrations of non-hydrocarbon components like acid gases and nitrogen. Verification with experimental data is recommended before accepting results from equations of state.

Case Studies:

Volatile Oil: Figures 1, 2 and 3 present the impact of CO2 and H2S and their mixture on the phase behavior of a volatile oil. The compositions of the light oil and the acid gas used to generate these two figures are shown in Table 1. For the properties (average normal boiling point, molecular weight and relative density of single carbon number (SCN), see Table 3.3 on page 64 of reference [1].  Both CO2 and H2S lower the cricondenbar of the volatile oil. These quantitative behaviors agree well with the qualitative ones shown in Figure 4.9 a and b. Figure 3 presents the impact of equal molar mixtures of CO2 and H2S on the volatile oil phase envelope. The net effect is almost midway of the effect of CO2 and H2S. In all three figures, the critical point of mixture shifts considerably to the left. The cricondentherm point also shifts to the left as the concentration of acid gases increase. The net effect is enhancing miscibility, shrinkage of the two phase region and expanding the liquid phase region. These are all desirable for enhanced oil recovery.


Figure 1. The impact of CO2 concentration on the volatile oil phase envelope


Rich Gas: The compositions of the rich gas and the non-hydrocarbons used to generate Figures 4, 5 and 6 are shown in Table 2. Figures 4, 5 and 6 present the impact of N2, CO2 and H2S on the phase behavior of the rich gas, respectively. As shown in Figure 4, N2 raises the cricondenbar of the rich gas. This quantitative behavior agrees well with the qualitative one shown in Figure 4.9 c. Nitrogen raises the cricondenbar, shifts the critical point to the left and decreases miscibility; therefore, it is best used for pressure maintenance. Miscibility can be attained only at very high pressures. Note for the case of 60 mole % in Figure 3, the bubble point curve and the critical point look abnormal which indicates that the equation of state and/or the binary interaction parameters used are incapable of handling high concentrations of N2

Figure 2. The impact of H2S concentration on the volatile oil phase envelope


Figure 3. The impact of acid gas (equal mole H2S and CO2) concentration on the volatile oil phase envelope.

 Figure 5 presents the impact of CO2 concentration on the rich gas phase envelope. Like the case of the volatile oil,  CO2 lowers the cricondenbar,  shifts the cricondentherm to the right but shifts the critical point to the left.

Figure 6 presents the impact of H2S concentration on the rich gas phase envelope. Both the critical and cricondentherm points shift to the right as H2S increases but the cricondenbar does not lower as it did for CO2.

Black Oil: Figures 7 and 8 present the impact of CO2 and H2S on the phase behavior of black oil. The compositions of the black oil and the acid gas used to generate these two figures are shown in Table 3.

As shown in Figure 7, contrary to the case of the volatile oil, the cricondenbar raises as the CO2 content increases but both the critical and cricondentherm points shift to the left. Compared to Figure 1 for the volatile oil, the impact of CO2 on the black oil phase envelope is much less.

            Table 1. Composition of the volatile oil used to generate Figures 1, 2, and 3.

* Acid Gas = H2S, CO2, or equal molar mixture of H2S, CO2.

The impact of H2S on this black oil is similar to its impact on the volatile oil (Figure 2). As shown in Figure 8, H2S lowers the cricondenbar of this black oil. The critical point shifts considerably to the left. The cricondentherm point also shifts to the left as the concentration of H2S increases. The net effect is enhancing miscibility, shrinkage of the two-phase region and expanding the liquid phase region. The impact of H2S on the black oil is less compared to the volatile oil shown in Figure 2.


Figure 4. The impact of N2 concentration on the rich gas phase envelope


Figure 5. The impact of CO2 concentration on the rich gas phase envelope


Figure 6. The impact of H2S concentration on the rich gas phase envelope

            Table 2. Composition of the rich gas used to generate Figure 4, 5, and 6.

* Non-Hydrocarbons = N2, H2S, or CO2,.


Figure 7. The impact of CO2 concentration on the black oil phase envelope

Figure 8. The impact of H2S concentration on the black oil phase envelope

             Table 3. Composition of the black oil used to generate Figures 7 and 8.

* For properties (average normal boiling point, molecular weight and relative density of single carbon number (SCN), see Table 3.3 page 64 of reference [1].


Conclusions:

The analysis of Figures 1 through 8 indicates that the impact of non-hydrocarbons on any reservoir fluids depends on the type/nature and composition of the reservoir fluid. The type of non-hydrocarbon as well as its concentration also plays an important role. The injection of acid gases into a reservoir fluid changes the phase behavior and the thermodynamic properties of the reservoir fluids. Even though not discussed in this TOTM, CO2 injection for the purpose of enhanced oil recovery may cause asphaltene deposition and blockage in the reservoir formation and the surface facilities. Depending on compositions, pressures and temperatures, much more complex phase behavior is possible. Multiple liquid phases (in addition to aqueous phase) and/or solids may be present.

It is important to use the right tools and an accurate equation of state within simulation software to generate the correct phase envelope. It is recommended to check the accuracy of the thermodynamic models against field/experimental data before generating any phase envelope. The equation of state should be tuned to match the laboratory measured vapor-liquid-equilibria data for a sample of the reservoir fluid before undertaking any practical study/decision. The results shown in this TOTM are specific to the cases studied and have not been validated with actual data. These results should be used only as a guideline.

To learn more about similar cases and how to minimize operational problems, we suggest attending our G40 (Process/Facility Fundamentals), G4 (Gas Conditioning and Processing), P81 (CO2 Surface Facilities), and PF4 (Oil Production and Processing Facilities) courses.

John M. Campbell Consulting (JMCC) offers consulting expertise on this subject and many others. For more information about the services JMCC provides, visit our website at www.jmcampbellconsulting.com, or email your consulting needs to consulting@jmcampbell.com.


By: Dr. Mahmood Moshfeghian

Reference:

  1. Campbell, J. M. “Gas conditioning and processing, Volume 1: Fundamentals,” John M. Campbell and Company, Norman, Oklahoma, USA, 2001.
  2. Peng, D. Y., and Robinson, D. B., Ind. Eng. Chem. Fundam., Vol. 15, p. 59, 1976.
  3. ProMax 3.2, Bryan Research and Engineering, Inc., Bryan, Texas, 2011.

5 responses to “Impact of Non-Hydrocarbons on the Reservoir Fluids Phase Envelope”

  1. Antony Balie Poncet says:

    very interesting topic,
    I would add that in many cases water content must be considered as it can signicantly affect phase equilibria,
    examples are H2O-CO2, H2O-H2S etc.
    this is also true for other reservoir fluids.
    While I agree that it is not easy to solve multiphase equilibria at high pressures for a mixture of hydrocarbons + water (i.e. std. EOS as Peng Robincon could not give accurate results for all fluids in the mixture) there are alternatives, for example for hydrocarbons + water there are the models developed by GERG and others.
    Nowadays simulators have procedures to plot a multiphase (vapor-liquid-solid) phase envelope, these are powerful tools for understanding phase equilibria,
    the same power is available in Excel or other Windows applications at lower costs with libraries,
    see for example
    http://www.prode.com/en/phaseenvelope.htm

  2. Charanjit Jootla says:

    The sentance “Note for the case of 60 mole % in Figure 3, the bubble point curve and the critical point look abnormal which indicates that the equation of state and/or the binary interaction parameters used are incapable of handling high concentrations of N2” from the article refers.

    I think there is a typo error since there is no reference to N2 in Figure 3 – I think Fig 3 should read Fig 4.

  3. A lot of the things you say is astonishingly precise and it makes me ponder why I hadn’t looked at this with this light previously. Your piece really did turn the light on for me as far as this particular subject matter goes. But there is 1 position I am not really too comfy with and whilst I try to reconcile that with the central idea of your issue, allow me observe what all the rest of the readers have to say.Well done.

  4. This will be a great blog, might you be interested in doing an interview regarding how you developed it? If so e-mail me!

Natural Gas with Dry Ice Phase Behavior

Wikipedia [1] describes dry ice as “the solid form of carbon dioxide (CO2). It is colorless, odorless, non-flammable, and slightly acidic [2]. At temperatures below −69.9°F (−56.6°C) and pressures below 75.2 psia (518 kPa), the triple point, CO2 changes from a solid to a gas with no intervening liquid form, through a process called sublimation. The opposite process is called deposition, where CO2 changes from the gas to solid  phase (dry ice). At atmospheric pressure, sublimation/ deposition occurs at  −109.3°F (−78.6°C). The density of dry ice varies, but usually ranges between about 87 and 100 lbm/ft3 (1400–1600 kg/m3) [3]. The low temperature and direct sublimation to a gas makes dry ice an effective coolant, since it is colder than water ice and leaves no residue as it changes state [4]. Its enthalpy of sublimation is 245.5 Btu/lbm (571 kJ/kg).”

While dry ice has many good features and applications, its formation can plug up equipment and cause severe operational problems in gas processing plants. Therefore, accurate predictions of conditions for dry ice formation are required. In order to prevent dry ice formation, a good knowledge and understanding of phase behavior of systems containing carbon dioxide are essential in cryogenic gas processing as in turboexpander plants for deep natural gas liquid (NGL) recovery. Thermodynamic modeling based on the equality of chemical potentials for each component in all phases and application of an equation of state with tuned parameters is normally used for accurate prediction of dry ice formation conditions.

In this tip of the month (TOTM), we will study the phase behavior of gas mixtures containing carbon dioxide. A description of phase behavior at different conditions of pressure and temperature is presented.

The Peng-Robinson (PR) [5] equation of state (EOS) option of ProMax [6] was used to perform all of the calculations in this study. In dealing with dry ice, reference [7] discusses the importance of using the right tools in process simulation software. The same reference also demonstrates the accuracy of ProMax against experimental data, including GPA RR 10 experimental data [8], for prediction of dry ice formation at different conditions.

Case Studies:

The composition of the two mixtures containing CO2 considered in this study is shown in Table 1. Figure 1 also presents a simplified process flow diagram that was used to study dry ice formation in this study.  The feed gas (stream 1) enters Sep-100 from which the vapor stream (stream 2) is cooled in HEX-100. The stream leaving this cooler is passed through Sep-101 for separation of gas and liquid.

Figure 2 presents a complete phase envelope for mixture A (see Table 1) in which the state of each region has been identified.

The feed gas (stream 1) enters Sep-100 at -96˚F and 300 psia (-71.1˚F and 2069 kPa) which is point “A” on Figure 2. At this condition, it is all vapor and all of the feed leaves the separator as vapor. In the HEX-100, the vapor stream (stream 2) is cooled at constant pressure to -160˚F (-106.7˚C), which is represented by point “E” (stream 4). The horizontal dotted straight line identifies the cooling path. During the cooling process when point “B”, the dew point, on Figure 2 is reached, the first drop of liquid is formed. Between points “B and C”, mixture of liquid + vapor coexist at equilibrium. At point C, the incipient point of dry ice, solid phase will also form. Between points “C and D”, three phases of solid + liquid + vapor will coexist at equilibrium. Further cooling to point “E” results in a mixture of solid + liquid at equilibrium. Finally, the stream leaving this cooler is passed through Sep-101 for separation of any gas from and liquid.

Table 1. The composition of the two mixture studies

Figure 1. A simplified process diagram for the case study

 If mixture A enters the cooler at a pressure less than 167 psia (1152 kPa) and cools down, it will form dry ice without forming any liquid. As an example, let’s  assume the mixture is at     -100˚F and 100 psia (-73˚C and 690 kPa), point “x” on Figure 2. If this gas is cooled at constant pressure of 100 psia (690 kPa), it forms dry ice at a temperature of about -133˚F (-92˚C). Further cooling below about -137˚F (-94˚C) will form solid + liquid + vapor at equilibrium. Finally, cooling below -200 ˚F (-129˚F) results in a mixture of solid + liquid in equilibrium.


Figure 2. Complete phase envelope for mixture A.


At a pressure of 300 psia (2069 kPa), starting at -90°F (-68°C) (Point “A”), the fluid is 100% vapor.  Cooling at constant pressure results in liquid formation when the temperature reaches about -113°F (-81°C) at Point “B”.  Further cooling results in dry ice formation at Point “C” and the temperature is approximately -119°F (-84°).  The last vapor bubble would disappear at Point “D” (about -156°F, -104°C).  Below this point, the fluid exists as dry ice and liquid.

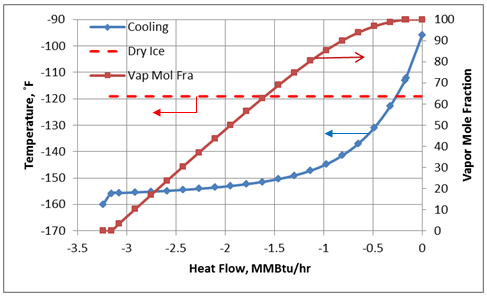
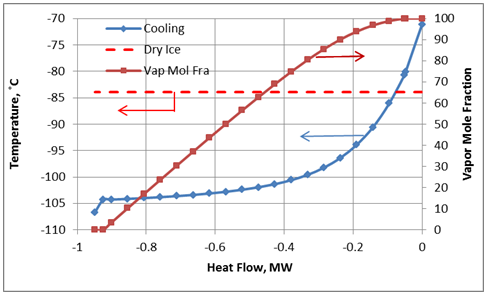
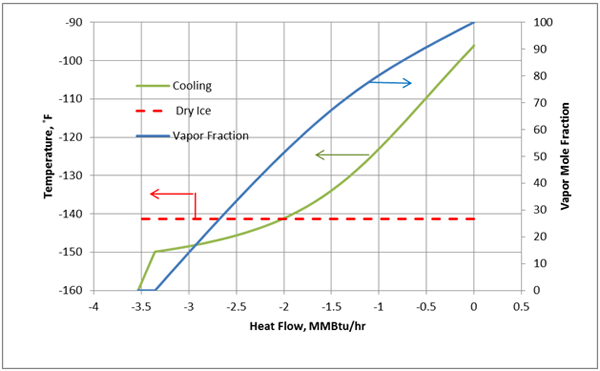
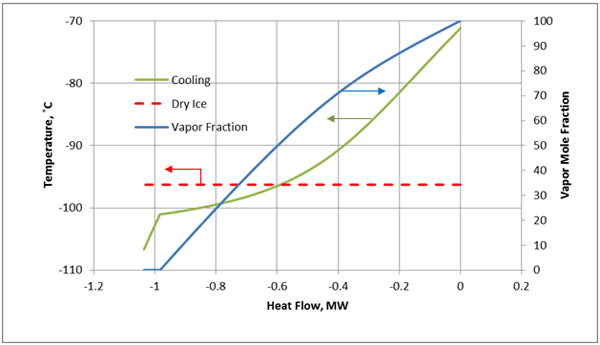
For the cooling process described above for a constant pressure of 300 psia,  the cooling temperature and vapor fraction of mixture as a function of heat removed from the process fluid (mixture A) in HEX-100 are shown in Figures 3A (Field Units) and 3B (SI Units).


Figure 3A. Temperature and vapor fraction of mixture A as it passes through HEX-100 (Field Units).


Figure 3B. Temperature and vapor fraction of mixture A as it passes through HEX-100 (SI Units).

Each mixture has a unique phase envelope and dry ice formation curve. As the mixture composition changes, the shape of the phase envelope and the dry ice curve will change. Similarly, a complete phase envelope for mixture B with the cooling path is shown in Figures 4, 5A, and 5B.


Figure 4. Complete phase envelope for mixture B.

Conclusions:

In cryogenic processes such as turboexpander plants for deep NGL recovery, accurate prediction of dry ice formation conditions is important. A good knowledge of phase behavior and thorough understanding of dry ice formation can prevent severe operational problems. On the phase envelope, any operating condition that lies on, to the left or below the dry ice curve (the dotted black curves on Figures 2 and 4) will form a solid phase and may cause severe operational problems, damage the equipment and lead to human casualty.

It is important to use the right tools and an accurate equation of state within simulation software to generate the correct phase envelope and dry ice curve. It is recommended to check the accuracy of the thermodynamic models against experimental data before generating any phase envelope or performing process simulation.


Figure 5A. Temperature and vapor fraction of mixture B as it passes through HEX-100 (Field Units).


To learn more about similar cases and how to minimize operational problems, we suggest attending our G40 (Process/Facility Fundamentals), G4 (Gas Conditioning and Processing), PF81 (CO2 Surface Facilities), and PF4 (Oil Production and Processing Facilities) courses.

John M. Campbell Consulting (JMCC) offers consulting expertise on this subject and many others. For more information about the services JMCC provides, visit our website at www.jmcampbellconsulting.com, or email your consulting needs to consulting@jmcampbell.com.


By: Dr. Mahmood Moshfeghian


Figure 5B. Temperature and vapor fraction of mixture B as it passes through HEX-100 (SI Units).


Reference:

  1. http://en.wikipedia.org/wiki/Dry_ice
  2. Yaws, C. Matheson gas data book (7th ed.). McGraw-Hill Professional. p. 982, 2001
  3. Häring, H-W. Industrial Gases Processing. Christine Ahner. Wiley-VCH, 2008
  4. Treloar, R., Plumbing Encyclopedia (3rd ed.). Wiley-Blackwell, 2003.
  5. Peng, D. Y., and Robinson, D. B., Ind. Eng. Chem. Fundam., Vol. 15, p. 59, 1976.
  6. ProMax 3.2, Bryan Research and Engineering, Inc, Bryan, Texas, 2011.
  7. Hlavinka, M. W., Hernandez, V. N., and McCartney, D., “Proper Interpretation of  Freezing and  Hydrate  Prediction Results From Process Simulation,” Proceedings of the Eighty-Fifth GPA Annual Convention. Grapevine, TX: Gas  Processors Association, 1999:121-127 GPA 2006.
  8. Kurata, F., “Solubility of Solid Carbon Dioxide in Pure Light Hydrocarbons and Mixtures of Light Hydrocarbons,” GPA Research Report RR-10, Gas Processors Association, 1974

6 responses to “Natural Gas with Dry Ice Phase Behavior”

  1. Sayeed Usman says:

    This Article carries a very important & interesting information’s for Gas Processing dealing with cryogenic gas processing.Thanks a lot.

  2. Carlo Stenali says:

    I would add that you can solve a enthalpy or entropy or volume specifications along with multiphase (vapor-liquid-solid) equilibria directly (with a equation of state as Soave Redlich Kwong or Peng Robinson or others),
    in the case, for example, of a natural gas mixture you can model a valve as adiabatic flash and verify immediately if there is solid formation, in some cases the problem being the accuracy of model, however in my tests (with Prode Properties which does multiphase) the results for CO2 are close to GPA (which you propose as reference)

  3. Great website. Loots of useful information here. I am
    sending it to some friends anns also sharing in delicious.

    And certainly, thanks to your effort!

    Review my web blog: carpet cleaning tampa

  4. Everything is very open with a precise description of the issues. It was really informative. Your site is useful. Many thanks for sharing!

  5. Kayo says:

    Very informative and crpehomnsive. Do we have similar figures for low pressures at the Regenerator still where the pressure is close to atmospheric and the temperature is around 370 deg F ? This is to determine how much of H2S / CO2 will be in the lean TEG solution AFTER Regenerator stripping i.e. how much of H2S / CO2 is unavoidable in the lean TEG solution.Also, solubility data at the Regenerator conditions will help in doing a rough mass balance of the H2S and CO2 which comes out with the rich TEG, how much leaves via the Flash Drum / Regenerator and how much gets recycled back to the Contactor via the lean TEG stream.

  6. Great post,Thanks for providing us this great knowledge

Effect of Nitrogen Impurities on CO2 Dense Phase Transportation

In the January and February 2012 tips of the month (TOTM) we discussed the isothermal and non-isothermal transportation of pure carbon dioxide (CO2) in the dense phase region. We illustrated how thermophysical properties changed in the dense phase and studied their impacts on pressure drop calculations. The pressure drop calculation results utilizing the liquid phase and vapor phase equations were exactly the same. We showed that the effect of the overall heat transfer coefficient on the pipeline temperature is significant. In this TOTM, we will study the same case study in the presence of nitrogen impurities under non-isothermal conditions. The Joule-Thompson expansion effect and the heat transfer between pipeline and surroundings have been considered. Specifically, we will report the effect of nitrogen impurities on the pressure and temperature profiles. The Peng-Robinson equation of state (PR EOS) was utilized in this study.

For a pure compound above critical pressure and critical temperature, the system is often referred to as a “dense fluid” or “super critical fluid” to distinguish it from normal vapor and liquid (see Figure 1 for carbon dioxide in December 2009 TOTM [1]).


Calculation Procedure:

The same step-by-step calculation procedure described in the February 2012 TOTM [2] was used to determine the pressure and temperature profiles in a pipeline considering the Joule-Thompson expansion effect and heat transfer between the pipeline and surroundings.

In the following section we will illustrate the pressure drop calculations for transporting CO2 in dense phase using the gas phase pressure drop equations. For details of pressure drop equations in the gas and liquid phases refer to the January 2012 TOTM [3].


Case Study:

For the purpose of illustration, we considered a case study [also described in reference 2] for transporting 160 MMSCFD (4.519×10⁶ Sm3/d) CO2 using a 100 miles (160.9 km) long pipeline with an inside diameter of 15.551 in (395 mm). The inlet conditions were 2030 psia (14 MPa) and 104˚F (40˚C). The following assumptions were made:

  1. CO2, with nitrogen impurities of 0, 1, 5, 10, and 15 mole %.
  2. Horizontal pipeline, no elevation change.
  3. Inside surface relative roughness’s (roughness factor), ε/D, of 0.00013.
  4. The ambient/surrounding temperature,Ts, is 55 ˚F and (12.8 ˚C)
  5. Overall heat transfer coefficients of 0.5 Btu/hr-ft2-˚F (2839 W/m2-˚C).


Properties: The dense phase behavior and properties were calculated using the Peng-Robinson equation of state (PR EOS) [4] in ProMax [5] software. ProMax was also used to determine pressure and temperature profiles along the pipeline.


Results and Discussions:

Figures 1 through 4 present the phase envelope, dry ice (CO2 freeze out) curve, and pipeline pressure and temperature profile for 1, 5, 10, and 15 mole % N2 impurities, respectively, the relative roughness (ε/D) of 0.00013, and the overall heat transfer coefficient (U) of 0.5 Btu/hr-˚F-ft2 (2.839 W/m2-˚C).

Figure 1. Phase envelop and dense phase pipeline pressure-temperature profile for 99 mole % CO2 + 1 mole % N2, ε/D=0.00013, and U=0.5 Btu/hr-˚F-ft2 (2.839 W/m2-˚C).

Figure 2. Phase envelop and dense phase pipeline pressure-temperature profile for 95 mole % CO2 + 5 mole % N2, ε/D=0.00013, and U=0.5 Btu/hr-˚F-ft2 (2.839 W/m2-˚C).

Figure 3. Phase envelop and dense phase pipeline pressure-temperature profile for 90 mole % CO2 + 10 mole % N2, ε/D=0.00013, and U=0.5 Btu/hr-˚F-ft2 (2.839 W/m2-˚C).

Figure 4. Phase envelop and dense phase pipeline pressure-temperature profile for 85 mole % CO2 + 15 mole % N2, ε/D=0.00013, and U=0.5 Btu/hr-˚F-ft2 (2.839 W/m2-˚C).


The effect of N2 impurities on the line temperature profile is shown in Figure 5. This figure indicates that N2 impurities have negligible effect on the pipeline temperature profile.

Figure 6 presents the effect of N2 impurities on the pipeline pressure profile. This figure indicates that as the N2 impurities increases the pressure drop increases. This can be explained by the fact as the N2 impurities increase, the mixture density decreases, consequently the velocity increases. Note the pressure drop is proportional to square of velocity and inverse of density. While viscosity decreases with increase in N2 impurities, its effect is not as large as the density effect. Table 1 presents variation of the mixture density and viscosity as a function of N2 mole %.

Table 1. Effect of N2 impurities on density (ρ) and viscosity (µ) of mixture at the inlet condition of 2030 psia (14 MPa) and 104˚F (40˚C)


Conclusions:
 

Analyzing Table 1 and Figures 1 through 6, the following conclusions can be made:

  1. For the range 0 to 15 mole % N2, the effect of the N2 impurities on the pipeline temperature profile is negligible.
  2. As the N2 impurities increase, the pipeline pressure drop increases due to the change in thermophysical properties of mixture.
  3. Care should be taken to use accurate thermophysical properties and the phase envelope should be plotted to avoid any operating problem.

Figure 5. Variation of the pipeline temperature profile with the N2 impurities and U=0.5 Btu/hr-˚F-ft2 (2.839 W/m2-˚C)

Figure 6. Variation of the pipeline pressure profile with the N2 impurities and U=0.5 Btu/hr-˚F-ft2 (2.839 W/m2-˚C)


To learn more about similar cases and how to minimize operational problems, we suggest attending our G40 (Process/Facility Fundamentals), G4 (Gas Conditioning and Processing), P81 (CO2 Surface Facilities), and PF4 (Oil Production and Processing Facilities) courses.

John M. Campbell Consulting (JMCC) offers consulting expertise on this subject and many others. For more information about the services JMCC provides, visit our website at www.jmcampbellconsulting.com, or email your consulting needs to consulting@jmcampbell.com.


By: Dr. Mahmood Moshfeghian

Reference:

  1. Bothamley, M.E. and Moshfeghian, M., “Variation of properties in the dese phase region; Part 1 – Pure compounds,” TOTM, http://www.jmcampbell.com/tip-of-the-month/2009/12/variation-of-properties-in-the-dense-phase-region-part-1-pure-compounds/, Dec 2009.
  2. Moshfeghian, M., ”Transportation of CO2 in the Dense Phase,” TOTM, http://www.jmcampbell.com/tip-of-the-month/2012/02/ , Feb 2012
  3. Moshfeghian, M., ”Transportation of CO2 in the Dense Phase,” TOTM, http://www.jmcampbell.com/tip-of-the-month/2012/01/, Jan 2012
  4. Peng, D. Y., and Robinson, D. B., Ind. Eng. Chem. Fundam., Vol. 15, p. 59, 1976.

ProMax 3.2, Bryan Research and Engineering

8 responses to “Effect of Nitrogen Impurities on CO2 Dense Phase Transportation”

  1. Very good submit. My partner and i examine something more difficult upon different sites each day. It genuinely ought to always be exciting to find out articles from various writers as well as observe a little another thing at their store. I would select make use of a few together with the written content on my website whether or not you do not thoughts. Natually I’ll supply you with a website link as part of your internet website. Many thanks for sharing.

  2. Tammy Malson says:

    There is no more.

  3. hello there and thank you for your information – I’ve definitely picked up something new from right here.
    I did however expertise some technical points using this website, since I experienced to reload the web site lots of times previous to I could get it to load correctly.

    I had been wondering if your hosting is OK? Not that I’m complaining, but slow loading instances times will often affect your placement in google
    and could damage your high-quality score if ads and marketing with Adwords.
    Well I am adding this RSS to my email and can look out for much more of your respective intriguing content.
    Make sure you update this again very soon.

    my page; norton 360 2014

  4. What i do not understood is in fact how you are not actually a lot more smartly-liked than you might be now.
    You are so intelligent. You know therefore significantly in terms of this topic, made me in my opinion believe it from
    so many numerous angles. Its like women and men are not fascinated unless it is something to
    do with Lady gaga! Your own stuffs outstanding. At all times take care of
    it up!

  5. Nice weblog my! possibly your site numerous up fast! precisely web host are additionally you the persue of? Cthe very I have used your associate hyperlink to your put? i started desire this fact website loaded up as quickly as yours lol

  6. I’ve recently started a blog, the information you offer on this website has helped me greatly. Thank you for all of your time & work.

  7. Geraldo says:

    I am really loving the theme/design of your
    site. Do you ever run into any browser compatibility issues?
    A number of my blog readers have complained about my blog not working correctly in Explorer but looks great in Safari.

    Do you have any suggestions to help fix this problem?

    Check out my webpage: personalized home decor
    [Geraldo]

  8. tip bong da says:

    You have lots of useful pointers on this site. This is a well composed article that I have bookmarked for future reading. Have a fun.

Non-Isothermal Transportation of CO2 in the Dense Phase

 In the January 2012 tip of the month (TOTM) we discussed the isothermal transportation of carbon dioxide (CO2) in the dense phase. We illustrated how thermophysical properties changed in the dense phase and studied their impacts on pressure drop calculations. The pressure drop calculation results utilizing the liquid phase and vapor phase equations were exactly the same. In this TOTM, we will study the same case study under non-isothermal conditions. The Joule-Thompson expansion effect and the heat transfer between pipeline and surroundings have been considered. Specifically, we will report the effects of the overall heat transfer coefficient and the relative roughness on the pressure and temperature profiles. The Span and Wagner CO2 equation of state (EOS) was utilized in this study.

For a pure compound, above critical pressure and critical temperature, the system is oftentimes referred to as a “dense fluid” or “super critical fluid” to distinguish it from normal vapor and liquid (see Figure 1 for carbon dioxide in December 2009 TOTM [1]).

Calculation Procedure:

The following step-by-step calculation procedure may be used to determine the pressure and temperature profiles in a pipeline considering the Joule-Thompson expansion effect and heat transfer between the pipeline and surroundings.

  1. Divide the pipeline into n segments. The segments may be different lengths, but should be carefully chosen to provide the information sought through the calculations to be made. The more segments, the longer the calculation time. Time, however, is a relatively small investment compared to the importance of adequate representation of the line profile.
  2. Assume an outlet pressure for each segment by use of a linear interpolation along the length of the line. Note that the outlet pressure of the first segment automatically becomes the inlet pressure to the second segment.
  3. For the first iteration calculation, assume the flow in the segment is isothermal.
  4. Calculate the average temperature, Tavg= (Tout + Tin)/2, and pressure, Pavg= (Pout + Pin)/2, for the first segment in the line. For the first iteration the inlet and outlet temperatures for the segment will be the same since isothermal flow is assumed.
  5. Using the EOS, determine the state of the flow at Tavg and Pavg to establish whether or not the flow is in the dense phase.
  6. Using the gas phase or liquid phase equations, calculate the segment pressure drop.
  7. Compare the calculated pressure at the end of a segment with the pressure that was assumed in step 2. If the difference between these pressures is sufficiently small, proceed to step 8. If the difference between the assumed and calculated pressure at the end of segment is too large (1 psi or 6.9 kPa), replace the assumed outlet pressure with the calculated value of the outlet pressure and repeat steps 4 through 7 as many times as necessary to calculate s suitable segment outlet pressure.
  8. Calculate the enthalpy at the end of the segment by writing an energy balance around the segment using the following procedure:
    Hout = Hin+ Q                        (1)
    Where:
    Q = UA (Tavg-Ts)                     (2)
    Hout= Enthalpy of the fluid at the outlet of the segment
    Hin= Enthalpy of the fluid at the inlet of the segmentQ = The overall heat transfer to or from the segment
    U = The overall heat transfer coefficient between the external surface of the pipe and its surroundings
    A = The external surface area of the segment of pipe
    Tavg = The average temperature of the segment
    Ts = The temperature of material surrounding the pipe
  9. Using the EOS, determine the segment outlet temperature based on the calculated Hout and Pout.
  10. If the temperature calculated in step 9 is the same as the assumed value in step 3, the calculations proceed to the next segment of the line. If the temperature is different from that assumed in step 3, calculations revert to step 4 using the newly calculated value for segment outlet temperature.

When conditions at the outlet end of the last segment of the line have been calculated to a satisfactory small difference (less than 1 psi or 6.9 kPa for pressure and less than 0.1 ˚F or 0.05 ˚C for temperature), calculations for flow conditions in the pipeline are complete.

In the following section we will illustrate the pressure drop calculations for transporting CO2 in dense phase using the gas phase pressure drop equations. For details of pressure drop equations in the gas and liquid phases refer to the January 2012 TOTM [2].

Case Study:

For the purpose of illustration, we considered a case study [also described in reference 2] for transporting 160 MMSCFD (4.519×10⁶ Sm3/d) CO2 using a 100 miles (160.9 km) long pipeline with an inside diameter of 15.551 in (395 mm). The corresponding mass flow rate is 214.7 lbm/sec (97.39 kg/s). The inlet conditions were 2030 psia (14 MPa) and 104˚F (40˚C). The following assumptions were made:

  1. Pure CO2, ignored any impurities such as N2.
  2. Horizontal pipeline, no elevation change.
  3. Five different inside surface relative roughness’s (roughness factor), ε/D, were studied (0.00004, 0.00013, 0.0002, 0.0004, and 0.001).
  4. The ambient/surrounding temperature,Ts, is 55 ˚F and (12.8 ˚C)
  5. Six different overall heat transfer coefficients ranging from 0 to 1 Btu/hr-ft2-˚F (0 to 5.678 W/m2-˚C) were studied.

Properties: The dense phase behavior and properties were calculated using the Span and Wagner CO2  EOS [3] in ProMax [4] software. ProMax was also used to determine pressure and temperature profiles along the pipeline.

Results and Discussions:

Figure 1 presents the pressure drop per unit length as a function of relative roughness (ε/D) and the overall heat transfer coefficient (U). In this figure, the values of U1 through U6 are 0, 0.125, 0.25, 0.5, 0.75, and 1.0 Btu/hr-˚F-ft2 (0, 0.71, 1.42, 2.839, 4.259, and 5.678 W/m2-˚C), respectively.

Figure 1. Variation of pressure drop with the relative roughness and the overall heat transfer coefficient.

            Figure 1 indicates that as the overall heat transfer coefficient increases, pressure drop decreases. This is because the line temperature drops more quickly at higher overall heat transfer coefficients. Note that as the U approaches 1.0 Btu/hr-˚F-ft2 (5.678 W/m2-˚C) its effect vanishes.

As an example, Tables 1 and 2 present the impact of relative roughness on the pressure drop for an overall heat transfer coefficient of 0 and 0.50 Btu/hr-˚F-ft2 (0 and 2.839 W/m2-˚C), respectively. These tables also present the line outlet temperatures.

Table 1. Impact of relative roughness on pressure drop (Number of segments=10).

Table 2. Impact of relative roughness on pressure drop (Number of segments=10).

These two tables and Figure 2 indicate that while the relative roughness has great impact on the pressure drop, its effect on temperature is small. On the other hand, the effect of overall heat transfer coefficient on the outlet temperature is more significant. The impact of U on the line temperature profile is shown in Figure 3. This figure also indicates that U has great impact on the line temperature profile. Figure 4 also indicates that the effect of relative roughness on the line temperature is negligible. Figure 5 presents the effect of the overall heat transfer confident on the line pressure profile. As can be seen in this figure, the increase in the overall heat transfer coefficient results in lower pressure drop. This is because the line temperature drops more quickly at the higher values of overall heat transfer coefficients.

Figure 2. Variation of the outlet temperature with the relative roughness and the overall heat transfer coefficient.


Figure 3. Variation of temperature profile with the overall heat transfer coefficient

Figure 4. Variation of the temperature profile with the pipe relative roughness

Figure 5. Variation of the line pressure profile with the overall heat transfer coefficient


Conclusions:

Analyzing Tables 1 and 2 and Figures 1 through 5, the following conclusions can be made:

  1. The effect of the overall heat transfer coefficient on the pipeline temperature is significant.
  2. As the overall heat transfer coefficient increases, the outlet temperature decreases.
  3. As the overall heat transfer coefficient increases, the outlet pressure increase (line pressure drop decreases).
  4. As the value of the heat transfer coefficient approaches 1.0 Btu/hr-˚F-ft2 (5.678 W/m2-˚C) its effect on the pipeline pressure drop vanishes.
  5. While pipeline roughness factor has great impact on the pressure drop, it has little effect on the pipeline temperature profile.

To learn more about similar cases and how to minimize operational problems, we suggest attending our G40 (Process/Facility Fundamentals), G4 (Gas Conditioning and Processing), P81 (CO2 Surface Facilities), and PF4 (Oil Production and Processing Facilities) courses.

John M. Campbell Consulting (JMCC) offers consulting expertise on this subject and many others. For more information about the services JMCC provides, visit our website at www.jmcampbellconsulting.com, or email your consulting needs to consulting@jmcampbell.com.

By: Dr. Mahmood Moshfeghian

Reference:

  1. Bothamley, M.E. and Moshfeghian, M., “Variation of properties in the dese phase region; Part 1 – Pure compounds,” http://www.jmcampbell.com/tip-of-the-month/2009/12/variation-of-properties-in-the-dense-phase-region-part-1-pure-compounds/, December 2009.
  2. Moshfeghian, M., ”Transportation of CO2 in the Dense Phase,” http://www.jmcampbell.com/tip-of-the-month/
  3. Span, R.; Wagner, W. – Equations of State for Technical Applications. I. Simultaneously Optimized Functional Forms for Nonpolar and Polar Fluids. Int. J. Thermophys. 2003,24(1), 1-39
  4. ProMax 3.2, Bryan Research and Engineering, Inc, Bryan, Texas, 2011.

6 responses to “Non-Isothermal Transportation of CO2 in the Dense Phase”

  1. Tabassam Nafees says:

    The TOTM is realy beefitting me a lot .It will be more help ful to me if the TOTM were also developed on natural gas Phase diagrame in lengnth.Thaks a lot for providing such forum where engineers can get valuable article of their inetrests.

  2. Michelle Barrios says:

    Thank you very much, these TOTM are very informational, comprehensible and have helped me a lot understanding CO2 transportation. Please keep up the good work.

  3. Hello would you mind letting me know which web host you’re using?
    I’ve loaded your blog in 3 completely different web browsers and
    I must say this blog loads a lot quicker then most.
    Can you recommend a good hosting provider at a fair price?
    Thanks a lot, I appreciate it!

  4. Appreciate the recommendation. Let me try it out.

    Also visit my web page … Bing.Com (http://Bing.Com)

  5. Vengas Bong says:

    Hmm. This can appear tough, but I honestly tell you to consider carefully the things you just stated. I completely disagree with you. Email me, and I will explain: vengasbong@gmail.com

  6. security says:

    Your websites are beautiful Make sure you continue to keep upgrade

Transportation of CO2 in Dense Phase

 In this tip of the month (TOTM) we will discuss transportation of carbon dioxide (CO2) in the dense phase. We will illustrate how thermophysical properties change in the dense phase and their impacts on pressure drop calculations. The pressure drop calculations results utilizing the liquid phase and vapor phase equations will be compared. The application of dense phase in the oil and gas industry will be discussed briefly. In a future TOTM, we will discuss the dense phase transportation of natural gas.

When a pure compound, in gaseous or liquid state, is heated and compressed above the critical temperature and pressure, it becomes a dense, highly compressible fluid that demonstrates properties of both liquid and gas. For a pure compound, above critical pressure and critical temperature, the system is oftentimes referred to as a “dense fluid” or “super critical fluid” to distinguish it from normal vapor and liquid (see Figure 1 for carbon dioxide in December 2009 TOTM [1]). Dense phase is a fourth (Solid, Liquid, Gas, Dense) phase that cannot be described by the senses. The word “fluid” refers to anything that will flow and applies equally well to gas and liquid. Pure compounds in the dense phase or supercritical fluid state normally have better dissolving ability than do the same substances in the liquid state. The dense phase has a viscosity similar to that of a gas, but a density closer to that of a liquid. Because of its unique properties, dense phase has become attractive for transportation of CO2 and natural gas, enhanced oil recovery, food processing and pharmaceutical processing products.

The low viscosity of dense phase, super critical carbon dioxide (compared with familiar liquid solvents), makes it attractive for enhanced oil recovery (EOR) since it can penetrate through porous media (reservoir formation). As carbon dioxide dissolves in oil, it reduces viscosity and oil-water interfacial tension, swells the oil and can provide highly efficient displacement if miscibility is achieved. Additionally, substances disperse throughout the dense phase rapidly, due to high diffusion coefficients. Carbon dioxide is of particular interest in dense-fluid technology because it is inexpensive, non-flammable, non-toxic, and odorless. Pipelines have been built to transport CO2 and natural gas in the dense phase region due to its higher density, and this also provides the added benefit of no liquids formation in the pipeline.

In the following section we will illustrate the pressure drop calculations for transporting CO2 in dense phase using liquid phase and vapor phase pressure drop equations.


Case Study:

For the purpose of illustration, we considered a case study for transporting 160 MMSCFD (4.519×10⁶ Sm3/d) CO2 using a 100 miles (160.9 km) long pipeline with an inside diameter of 15.551 in (395 mm). The corresponding mass flow rate is 214.7 lbm/sec (97.39 kg/s). The inlet conditions were 2030 psia (14 MPa) and 104˚F (40˚C). The following assumptions were made:

  1. Pure CO2, ignored any impurities such as N2.
  2. Horizontal pipeline, no elevation change.
  3. Inside surface relative roughness (roughness factor), ε/D, is 0.00004.
  4. Isothermal transportation of CO2.

Properties: Dense phase behavior is unique and has special features. The thermophysical properties in this phase may vary abnormally. Care should be taken when equations of state are used to predict thermophysical properties in dense phase. Evaluation of equations of state should be performed in advance to assure their accuracy in this region. Many simulators offer the option to use liquid-based algorithms (e.g. COSTALD [2]) for this region. Dense phase is a highly compressible fluid that demonstrates properties of both liquid and gas. The dense phase has a viscosity similar to that of a gas, but a density closer to that of a liquid. This is a favorable condition for transporting CO2 and natural gas in dense phase as well as carbon dioxide injection into crude oil reservoir for enhanced oil recovery.

Figures 1 and 2 present variation of density and viscosity of CO2 with pressure at constant temperature of 104 ˚F (40 ˚C) calculated by the SRK EOS and COSTALD liquid density option in ProMax [3] and the Span and Wagner CO2  EOS in REFPROP [4] software. Note, ProMax also has the Span and Wagner CO2  EOS option which produced practically the same results as the REFPPROP.


Figure 1. Density-Pressure diagram for CO2 at 104˚F (40˚C) by the SRK EOS and COSTALD liquid in ProMax and Span and Wagner CO2  EOS in REFPROP


Figure 2. Viscosity-Pressure diagram for CO2 at 104˚F (40˚C) by the SRK EOS and COSTALD liquid in ProMax and Span and Wagner CO2  EOS in REFPROP


For the sake of easier calculation steps, these diagrams were fitted to the following 3rd degree polynomials for density and viscosity, respectively:


In these equations, ρ is density (kg/m3), µ is viscosity (cP) and Pavg is the average pipeline segment pressure calculated by:

The fitted coefficients for equations 1 and 2 are presented in Table 1.


Table 1. The fitted coefficients for CO2 density and viscosity (Equations 1 & 2) at 104˚F (40˚C)


Figures 1 and 2 clearly indicate that there are large differences between predicted properties using two different sources. In the following section, we will illustrate the impact of these differences on pressure drop calculations.


Liquid Phase Pressure Drop Equations: The pressure drop for a liquid phase is calculated as follows.


Where:


Vapor Phase Pressure Drop Equations: In addition to Equations 5 through 8, which are also valid and used for the gas pipeline, the following equations are also used.


Where:


Results and Discussions:

The pressure drop calculations were performed using the liquid phase and vapor phase equations. First, the pipeline cross sectional area was calculated with Equation 8 and the gas density at the standard condition was calculated with equation 10.  In each case the calculation was trial and error and the following step-by-step procedure was followed:

  1. The line was divided into n segments (e.g. n = 1, 10, 20, or 100).
  2. For segment 1, an outlet pressure was guessed.
  3. Segment average pressure was calculated with Equation 3.
  4. CO2 density and viscosity were calculated using Equations 1 and 2, respectively.
  5. CO2 velocity was calculated with Equation 7.
  6. Reynolds number was calculated with Equation 6.
  7. Friction factor was calculated with Equation 5 (this is also trial and error).
  8. Liquid phase pressure drop was calculated with equation 4.
  9. Calculate average gas compressibility factor with equation 11.
  10. Calculate segment gas outlet pressure by Equation 9 and segment pressure drop with Equation 12.
  11. If the calculated outlet pressure is not the same as the guessed outlet pressure in step 2, replace the guessed outlet pressure with the calculated outlet pressure and repeat steps 3 through 10 until the calculated outlet pressure becomes equal to the guessed value.
  12. Use the calculated outlet pressure of segment “1” for the inlet of segment “2” and repeat the above steps for each segment till the end of line is reached.

Table 2 summarizes the pressure drop calculation results for four cases in which the pipeline was divided into 1, 10, 20, and 100 segments. Table 2 indicates that for the cases of 10 segments and higher no change in pressure drop is observed.


Table 2. Summary of pressure drop calculation results for different number of segments and different sources of properties.


For all cases tested, both the liquid phase and the vapor phase pressure drop equations gave exactly the same pressure drop. Note that there is at least 100 psi (690 kPa) difference in pressure drops calculation using REFPROP (Span and Wagner CO2 EOS) or ProMax (SRK EOS and COSTALD liquid density) because the EOS options were different. However, the Span and Wagner CO2 EOS in both software would result in the same pressure drop. A sample calculation in MathCad format is attached: Dense Phase CO2 Pipeline 1 Segment ProMax.

Table 3 presents the impact of relative roughness on pressure drop. Typical / generally accepted numbers for relative roughness are (and these are regarded as conservative) for steel pipes are:  new or clean service  =  0.00004, mildly corroded  =   0.0002, corroded / dirty service =  0.0004.

Table 3. Impact of relative roughness on pressure drop (Number of segments=10).

Conclusions:

As discussed in December 2009, dense phase behavior is unique and has special features. The thermophysical properties in this phase may vary abnormally. Care should be taken when equations of state are used to predict thermophysical properties in dense phase. Evaluation of equations of state should be performed in advance to assure their accuracy in this region. Many simulators offer the option to use liquid-based algorithms (e.g. COSTALD) for this region. It is very important to use the most appropriate option.

Dense phase is a highly compressible fluid that demonstrates properties of both liquid and gas. The dense phase has a viscosity similar to that of a gas, but a density closer to that of a liquid. This is a favorable condition for transporting CO2 and natural gas in dense phase. It was also found that either the liquid phase or vapor phase pressure drop equations can be used to calculate CO2 pressure drop in the dense phase. Both set of equations gave exactly the same pressure drop. Due to high density of CO2 in the dense phase, pressure drop due to elevation change should not be ignored.

To learn more about similar cases and how to minimize operational problems, we suggest attending our G40 (Process/Facility Fundamentals), G4 (Gas Conditioning and Processing), P81 (CO2 Surface Facilities), and PF4 (Oil Production and Processing Facilities) courses.

By: Dr. Mahmood Moshfeghian

Reference:

  1. Bothamley, M.E. and Moshfeghian, M., “Variation of properties in the dese phase region; Part 1 – Pure compounds,” http://www.jmcampbell.com/tip-of-the-month/2009/12/variation-of-properties-in-the-dense-phase-region-part-1-pure-compounds/, December 2009.
  2. Hankinson, R. W., Thomson, G. H., AIChE J., Vol. 25, no. 4, pp. 653-663, 1979.
  3. ProMax 3.2, Bryan Research and Engineering, Inc, Bryan, Texas, 2011.
  4. NIST Reference Fluid Thermodynamic and Transport Properties Database (REFPROP): Version 9.0, 2011.


7 responses to “Transportation of CO2 in Dense Phase”

  1. J. Castel says:

    This TOTM shows that large differences are obtained in the dense phase properties when using the two references studied in this paper and comments as follows:
    “Care should be taken when equations of state are used to predict thermophysical properties in dense phase. Evaluation of equations of state should be performed in advance to assure their accuracy in this region”.
    The easy way for the designer would be to always use the most conservative results when specifying a process operating in dense phase but it may become costly. Any suggestion on how to validate whether the less conservative results can be used safely?

  2. W. Wright says:

    I think the primary recommendation is to validate your properties model. If you don’t do any validation, then how do you know if your design is conservative or not – and by how much?

    For the fun of it, I re-ran this design example assuming the densities were actually 10% lower than predicted by the Span & Wagner EOS. Viscosity values were used directly from the Span & Wagner EOS.

    The pressure drop I calculate for the 100 mile pipeline increased from 273 psi (1.88 MPa) to approximately 301 psi (2.08 MPa) with a relative roughness of 0.00004. I can then decide if my system can tolerate that much variation. If not, I may want to do some work to ensure my properties predictions are sufficiently accurate.

    Your question is a good one, even if you do validate your fluids properties model. This example assumes 100% pure CO2. None of the existing CO2 pipelines that I am aware of contain 100% pure CO2. There are always contaminants. From my experience, the Span & Wagner EOS does an excellent job of predicting properties of pure CO2, but it is not applicable for multi-component systems.

    So what happens if the CO2 is not pure? I can validate my fluid model (something other than Span & Wagner), but what if the assumed composition is wrong or if the composition changes over time?

    One of the advantages of computer-based design, is that I can, with relative ease, evaluate the sensitivity of my system to different fluid compositions and/or evaluate the impact of inaccurate data. In some cases, better properties prediction may be necessary to avoid over-spending on the pipeline. In other cases, over-building may be necessary to accommodate the unknown or unknowable.

    • L. Addington says:

      Something to add, SRK provides relatively poor results in the dense phase region for CO2. In any simulator, including ProMax, if you have a stream containing some contaminants such as methane, water, N2, etc. (thereby making Span and Wagner unusable), Peng-Robinson is an inherently more accurate EOS for dense phase CO2. See the image below:

      http://i1150.photobucket.com/albums/o611/laddington/Densities.jpg

      COSTALD is a liquid density method and, although we may have a fluid that has liquid-like properties, it is not appropriate to apply this method to our dense phase stream. The molar volume values coming out of the equation-of-state are suitable for the vapor and “dense” phases; they do not need correction by COSTALD or RACKETT.

      ProMax does not have a phase titled “dense” and must therefore define the stream either as a vapor or a liquid when it is above the critical. COSTALD is only applied to the liquid, so as long as the stream is being called a vapor (and it is defined as a vapor in ProMax over the range presented by Mahmoud) the EOS is actually being used, regardless of the settings applied. The densities displayed in Figure 1, therefore, were not calculated using COSTALD, rather they are being predicted by the SRK EOS.

      As Mahmoud said, it is important to understand where the predictions are as compared to data. This is true for any system, but especially true for this one. Ms. Castel is right that we would prefer to be conservative, but there’s a fine line between being conservative and being incorrect. Errors on densities of 15-20% can be detrimental when considering, for example, elevation changes in pipelines. This is especially true for injection wells which may have an elevation change of tens of thousands of feet. So even if a more “conservative” method is accepted, it is still important to know how conservative. We would like to have predictions as close to the correct answer as possible, understand the deficiencies and “unknowns” in the predictions, as Wright described, and then apply our engineering judgment to obtain a feasible, safe design.

  3. Mainly interested in compression, heat transfer, fluids and any mathematical models in relation to them.

  4. ahmed says:

    i have question please when i use the equation of agas to calculate po the output differ to what you calculate in Dense Phase CO2 Pipeline 1 Segment ProMax. please i want to know the dimension for the length & diameter

  5. Transportation of CO2 in Dense Phase | Campbell Tip of the Month
    roger vivier sale http://www.hardingalumni.org/rv.htm/

  6. always i used to read smaller posts that as well clear their motive,
    and that is also happening with this paragraph which I am reading now.